Proctor and Gamble 2013 Annual Report Download - page 59
Download and view the complete annual report
Please find page 59 of the 2013 Proctor and Gamble annual report below. You can navigate through the pages in the report by either clicking on the pages listed below, or by using the keyword search tool below to find specific information within the annual report.-
 1
1 -
2
-
3
-
4
-
5
-
6
-
7
-
8
-
9
-
10
-
11
-
12
-
13
-
14
-
15
-
16
-
17
-
18
-
19
-
20
-
21
-
22
-
23
-
24
-
25
-
26
-
27
-
28
-
29
-
30
-
31
-
32
-
33
-
34
-
35
-
36
-
37
-
38
-
39
-
40
-
41
-
42
-
43
-
44
-
45
-
46
-
47
-
48
-
 49
49 -
 50
50 -
 51
51 -
 52
52 -
 53
53 -
 54
54 -
 55
55 -
 56
56 -
 57
57 -
 58
58 -
 59
59 -
 60
60 -
 61
61 -
 62
62 -
 63
63 -
 64
64 -
 65
65 -
 66
66 -
 67
67 -
 68
68 -
 69
69 -
70
-
71
-
72
-
73
-
74
-
75
-
76
-
77
-
78
-
79
-
80
-
81
-
82
-
83
-
84
-
85
-
86
-
87
-
88
-
89
-
90
-
91
-
92
 |
 |
The Procter & Gamble Company 57
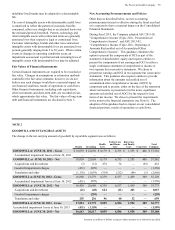
Amounts in millions of dollars except per share amounts or as otherwise specified.
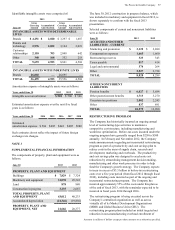
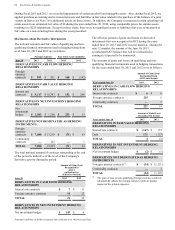
Identifiable intangible assets were comprised of:
2013 2012
June 30
Gross
Carrying
Amount
Accumulated
Amortization
Gross
Carrying
Amount
Accumulated
Amortization
INTANGIBLE ASSETS WITH DETERMINABLE
LIVES
Brands $ 4,251 $ 2,020 $ 3,297 $ 1,687
Patents and
technology 2,976 2,032 3,164 2,021
Customer
relationships 2,118 703 2,048 642
Other 348 168 352 218
TOTAL 9,693 4,923 8,861 4,568
INTANGIBLE ASSETS WITH INDEFINITE LIVES
Brands 26,802 — 26,695 —
TOTAL 36,495 4,923 35,556 4,568
Amortization expense of intangible assets was as follows:
Years ended June 30 2013 2012 2011
Intangible asset amortization $ 528 $ 500 $ 546
Estimated amortization expense over the next five fiscal
years is as follows:
Years ended June 30 2014 2015 2016 2017 2018
Estimated
amortization expense $ 504 $485 $442 $405 $380
Such estimates do not reflect the impact of future foreign
exchange rate changes.
NOTE 3
SUPPLEMENTAL FINANCIAL INFORMATION
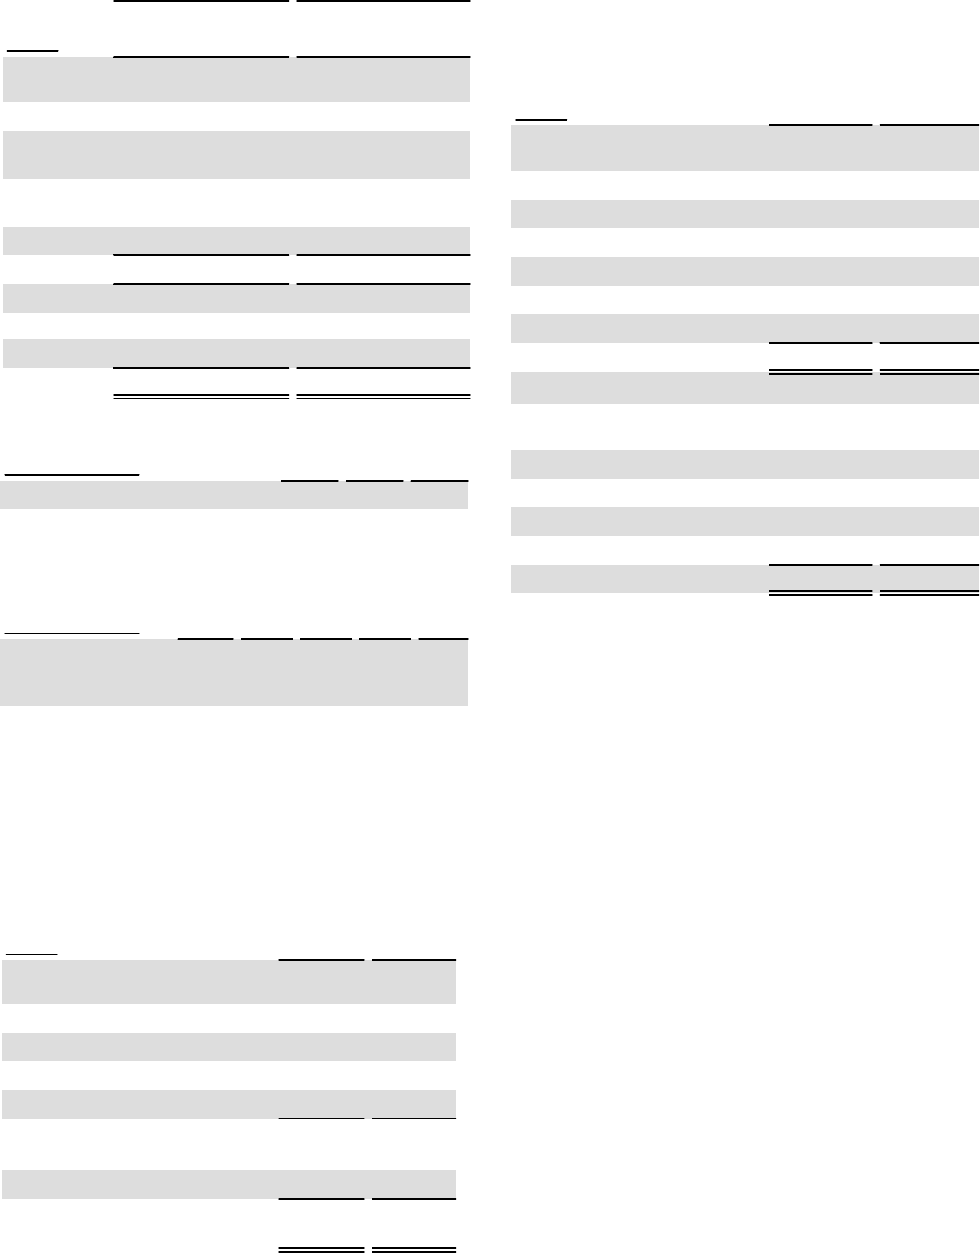
The components of property, plant and equipment were as
follows:
June 30 2013 2012
PROPERTY, PLANT AND EQUIPMENT
Buildings $ 7,829 $ 7,324
Machinery and equipment 31,070 29,342
Land 878 880
Construction in progress 3,235 2,687
TOTAL PROPERTY, PLANT
AND EQUIPMENT 43,012 40,233
Accumulated depreciation (21,346) (19,856)
PROPERTY, PLANT AND
EQUIPMENT, NET 21,666 20,377
The June 30, 2012 construction in progress balance, which
was included in machinery and equipment in fiscal 2012, is
shown separately to conform with the fiscal 2013
presentation.
Selected components of current and noncurrent liabilities
were as follows:
June 30 2013 2012
ACCRUED AND OTHER
LIABILITIES - CURRENT
Marketing and promotion $ 3,122 $ 2,880
Compensation expenses 1,665 1,660
Restructuring reserves 323 343
Taxes payable 817 414
Legal and environmental 374 264
Other 2,527 2,728
TOTAL 8,828 8,289
OTHER NONCURRENT
LIABILITIES
Pension benefits $ 6,027 $ 5,684
Other postretirement benefits 1,713 3,270
Uncertain tax positions 2,002 2,245
Other 837 891
TOTAL 10,579 12,090
RESTRUCTURING PROGRAM
The Company has historically incurred an ongoing annual
level of restructuring-type activities to maintain a
competitive cost structure, including manufacturing and
workforce optimization. Before-tax costs incurred under the
ongoing program have generally ranged from $250 to $500
annually. In February and November 2012, the Company
made announcements regarding an incremental restructuring
program as part of a productivity and cost savings plan to
reduce costs in the areas of supply chain, research and
development, marketing and overheads. The productivity
and cost savings plan was designed to accelerate cost
reductions by streamlining management decision making,
manufacturing and other work processes in order to help
fund the Company's growth strategy. The Company expects
to incur in excess of $3.5 billion in before-tax restructuring
costs over a five year period (from fiscal 2012 through fiscal
2016), including costs incurred as part of the ongoing and
incremental restructuring program. The Company has
incurred approximately 55% of the costs under this plan as
of the end of fiscal 2013, with the remainder expected to be
incurred in fiscal years 2014 through 2016.
The restructuring program is being executed across the
Company's centralized organization as well as across
virtually all of its Market Development Organizations
(MDO) and Global Business Units (GBU). The
restructuring program plans included an initial targeted net
reduction in non-manufacturing overhead enrollment of