Proctor and Gamble 2013 Annual Report Download - page 54
Download and view the complete annual report
Please find page 54 of the 2013 Proctor and Gamble annual report below. You can navigate through the pages in the report by either clicking on the pages listed below, or by using the keyword search tool below to find specific information within the annual report.-
 1
1 -
2
-
3
-
4
-
5
-
6
-
7
-
8
-
9
-
10
-
11
-
12
-
13
-
14
-
15
-
16
-
17
-
18
-
19
-
20
-
21
-
22
-
23
-
24
-
25
-
26
-
27
-
28
-
29
-
30
-
31
-
32
-
33
-
34
-
35
-
36
-
37
-
38
-
39
-
40
-
41
-
42
-
43
-
 44
44 -
 45
45 -
 46
46 -
 47
47 -
 48
48 -
 49
49 -
 50
50 -
 51
51 -
 52
52 -
 53
53 -
 54
54 -
 55
55 -
 56
56 -
 57
57 -
 58
58 -
 59
59 -
 60
60 -
 61
61 -
 62
62 -
 63
63 -
 64
64 -
65
-
66
-
67
-
68
-
69
-
70
-
71
-
72
-
73
-
74
-
75
-
76
-
77
-
78
-
79
-
80
-
81
-
82
-
83
-
84
-
85
-
86
-
87
-
88
-
89
-
90
-
91
-
92
 |
 |

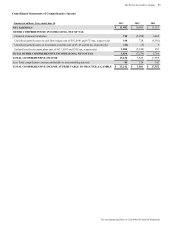
52 The Procter & Gamble Company
See accompanying Notes to Consolidated Financial Statements.
Consolidated Statements of Cash Flows
Amounts in millions; Years ended June 30 2013 2012 2011
CASH AND CASH EQUIVALENTS, BEGINNING OF YEAR $ 4,436 $ 2,768 $ 2,879
OPERATING ACTIVITIES
Net earnings 11,402 10,904 11,927
Depreciation and amortization 2,982 3,204 2,838
Share-based compensation expense 346 377 414
Deferred income taxes (307) (65) 128
Gain on sale and purchase of businesses (916) (2,106) (203)
Goodwill and indefinite-lived intangible asset impairment charges 308 1,576 —
Change in accounts receivable (415) (427) (426)
Change in inventories (225) 77 (501)
Change in accounts payable, accrued and other liabilities 1,253 (22) 358
Change in other operating assets and liabilities 68 (444) (1,221)
Other 377 210 16
TOTAL OPERATING ACTIVITIES 14,873 13,284 13,330
INVESTING ACTIVITIES
Capital expenditures (4,008) (3,964) (3,306)
Proceeds from asset sales 584 2,893 225
Acquisitions, net of cash acquired (1,145) (134) (474)
Purchases of available-for-sale investment securities (1,605) ——
Change in other investments (121) 112 73
TOTAL INVESTING ACTIVITIES (6,295) (1,093) (3,482)
FINANCING ACTIVITIES
Dividends to shareholders (6,519) (6,139) (5,767)
Change in short-term debt 3,406 (3,412) 151
Additions to long-term debt 2,331 3,985 1,536
Reductions of long-term debt (3,752) (2,549) (206)
Treasury stock purchases (5,986) (4,024) (7,039)
Impact of stock options and other 3,449 1,729 1,203
TOTAL FINANCING ACTIVITIES (7,071) (10,410) (10,122)
EFFECT OF EXCHANGE RATE CHANGES ON CASH AND CASH EQUIVALENTS 4(113) 163
CHANGE IN CASH AND CASH EQUIVALENTS 1,511 1,668 (111)
CASH AND CASH EQUIVALENTS, END OF YEAR $ 5,947 $ 4,436 $ 2,768
SUPPLEMENTAL DISCLOSURE
Cash payments for:
Interest $ 683 $ 740 $ 806
Income taxes 3,780 4,348 2,992
Assets acquired through non-cash capital leases are immaterial for all periods.