Sony 2011 Annual Report Download - page 36
Download and view the complete annual report
Please find page 36 of the 2011 Sony annual report below. You can navigate through the pages in the report by either clicking on the pages listed below, or by using the keyword search tool below to find specific information within the annual report.-
 1
1 -
2
-
3
-
4
-
5
-
6
-
7
-
8
-
9
-
10
-
11
-
12
-
13
-
14
-
15
-
16
-
17
-
18
-
19
-
20
-
21
-
22
-
23
-
24
-
25
-
 26
26 -
 27
27 -
 28
28 -
 29
29 -
 30
30 -
 31
31 -
 32
32 -
 33
33 -
 34
34 -
 35
35 -
 36
36 -
 37
37 -
 38
38 -
 39
39 -
 40
40 -
 41
41 -
 42
42 -
 43
43 -
 44
44 -
 45
45 -
 46
46 -
47
-
48
-
49
-
50
-
51
-
52
-
53
-
54
-
55
-
56
-
57
-
58
-
59
-
60
-
61
-
62
-
63
-
64
-
65
-
66
-
67
-
68
-
69
-
70
 |
 |

34
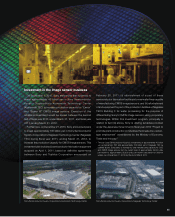
●Consolidated operating income was signicantly higher, 6.3 times the previous scal year’s amount, despite the large, unfavorable
impact of foreign exchange rates.
●The increase in consolidated operating income was driven primarily by improved results in the Networked Products & Services
segment, due principally to the contribution of the game business.
●A net loss attributable to Sony Corporation’s stockholders was recorded, mainly due to a non-cash charge to establish a valuation
allowance against certain deferred tax assets in Japan.
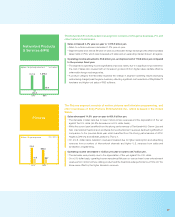
Sales and operating revenue ¥7,181.3 billion (-0.5%)
Operating income ¥199.8 billion (+528.9%)
Income before income taxes ¥205.0 billion (+661.8%)
(¥259.6 billion) ( — )
Note: Percentage change from the previous fiscal year is shown in parentheses.
Consolidated Financial Results for the
Fiscal Year Ended March 31, 2011 (Fiscal Year 2010)
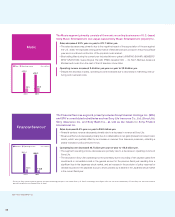
Net income (loss) attributable to
Sony Corporation’s stockholders
Sales and operating revenue
(Yen in trillions)
7.7 7.2 7.2
2009 2010 2011
Net income (loss) attributable to
Sony Corporation’s stockholders
(Yen in billions)
(98.9)
(259.6)
-9.4%
(40.8)
-1.4%
-3.1%
2009 2010 2011
Operating income (loss)
(Yen in billions)
199.8
252.8
31.8
213.4
(227.8)
(127.3)
2009 2010 2011
Net income (loss) attributable to
Sony Corporation’s stockholders
Return on Equity (ROE)
Operating income (loss)
Operating income (loss), as adjusted, which
excludes equity in net income (loss) of affili-
ated companies and restructuring charges
Note: Fiscal year ended March 31, 2010 operating
income, as adjusted, also excludes a non-cash
charge related to LCD television asset impairment.
Note: Years ended March 31
Financial Highlights Consolidated Results