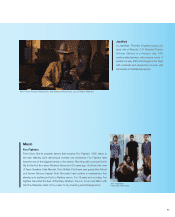
Sony 2011 Annual Report Download - page 58
Download and view the complete annual report
Please find page 58 of the 2011 Sony annual report below. You can navigate through the pages in the report by either clicking on the pages listed below, or by using the keyword search tool below to find specific information within the annual report.-
 1
1 -
2
-
3
-
4
-
5
-
6
-
7
-
8
-
9
-
10
-
11
-
12
-
13
-
14
-
15
-
16
-
17
-
18
-
19
-
20
-
21
-
22
-
23
-
24
-
25
-
26
-
27
-
28
-
29
-
30
-
31
-
32
-
33
-
34
-
35
-
36
-
37
-
38
-
39
-
40
-
41
-
42
-
43
-
44
-
45
-
46
-
47
-
 48
48 -
 49
49 -
 50
50 -
 51
51 -
 52
52 -
 53
53 -
 54
54 -
 55
55 -
 56
56 -
 57
57 -
 58
58 -
 59
59 -
 60
60 -
 61
61 -
 62
62 -
 63
63 -
 64
64 -
 65
65 -
 66
66 -
 67
67 -
 68
68 -
69
-
70
 |
 |

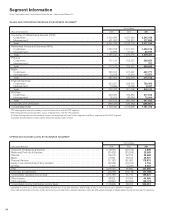
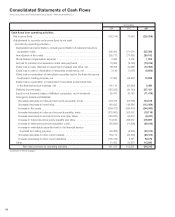
Consolidated Balance Sheets
Sony Corporation and Consolidated Subsidiaries—As of March 31
Yen in millions
2010 2011
ASSETS
Current assets:
Cash and cash equivalents ........................................................
1,191,608 1,014,412
Marketable securities ............................................................
579,493 646,171
Notes and accounts receivable, trade. . . . . . . . . . . . . . . . . . . . . . . . . . . . . . . . . . . . . . . . . . . . . . . .
996,100 834,221
Allowance for doubtful accounts and sales returns ......................................
(104,475) (90,531)
Inventories ....................................................................
645,455 704,043
Deferred income taxes ...........................................................
197,598 133,059
Prepaid expenses and other current assets . . . . . . . . . . . . . . . . . . . . . . . . . . . . . . . . . . . . . . . . . . .
627,093 602,671
Total current assets ............................................................
4,132,872 3,844,046
Film costs .....................................................................
310,065 275,389
Investments and advances:
Affiliated companies .............................................................
229,051 221,993
Securities investments and other ...................................................
5,070,342 5,670,662
.........................................................................
5,299,393 5,892,655
Property, plant and equipment:
Land ........................................................................
153,067 145,968
Buildings .....................................................................
897,054 868,615
Machinery and equipment ........................................................
2,235,032 2,016,956
Construction in progress .........................................................
71,242 53,219
.........................................................................
3,356,395 3,084,758
Less—Accumulated depreciation ...................................................
(2,348,444) (2,159,890)
.........................................................................
1,007,951 924,868
Other assets:
Intangibles, net .................................................................
378,917 391,122
Goodwill ......................................................................
438,869 469,005
Deferred insurance acquisition costs ................................................
418,525 428,262
Deferred income taxes ...........................................................
403,537 239,587
Other ........................................................................
475,985 460,054
Total other assets .............................................................
2,115,833 1,988,030
Total assets
...................................................................
12,866,114 12,924,988
(Continued on following page.)
56