Sony 2011 Annual Report Download - page 57
Download and view the complete annual report
Please find page 57 of the 2011 Sony annual report below. You can navigate through the pages in the report by either clicking on the pages listed below, or by using the keyword search tool below to find specific information within the annual report.-
 1
1 -
2
-
3
-
4
-
5
-
6
-
7
-
8
-
9
-
10
-
11
-
12
-
13
-
14
-
15
-
16
-
17
-
18
-
19
-
20
-
21
-
22
-
23
-
24
-
25
-
26
-
27
-
28
-
29
-
30
-
31
-
32
-
33
-
34
-
35
-
36
-
37
-
38
-
39
-
40
-
41
-
42
-
43
-
44
-
45
-
46
-
 47
47 -
 48
48 -
 49
49 -
 50
50 -
 51
51 -
 52
52 -
 53
53 -
 54
54 -
 55
55 -
 56
56 -
 57
57 -
 58
58 -
 59
59 -
 60
60 -
 61
61 -
 62
62 -
 63
63 -
 64
64 -
 65
65 -
 66
66 -
 67
67 -
68
-
69
-
70
 |
 |

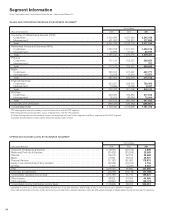
SALES AND OPERATING REVENUE TO CUSTOMERS BY PRODUCT CATEGORY
Yen in millions
Years ended March 31 2009 2010 2011
Consumer, Professional & Devices
Televisions .....................................................
1,275,692 1,005,773 1,200,491
Digital Imaging .................................................. 831,820
664,502 642,570
Audio and Video ................................................. 531,542
449,882 426,594
Semiconductors ................................................. 310,682
299,715 358,396
Components .................................................... 613,013
476,097 410,090
Professional Solutions ............................................. 346,326
295,360 287,394
Other ......................................................... 17,311
16,217 19,513
Total ............................................................ 3,926,386
3,207,546 3,345,048
Networked Products & Services
Game ......................................................... 984,855
840,711 798,405
PC and Other Networked Businesses ................................. 699,903
670,864 694,731
Total ............................................................ 1,684,758
1,511,575 1,493,136
Pictures ......................................................... 717,513
705,237 599,654
Music ........................................................... 363,074
511,097 457,771
Financial Services .................................................. 523,307
838,300 798,495
All Other ......................................................... 453,603
379,862 377,816
Corporate ........................................................ 61,352
60,381 109,353
Consolidated total ................................................. 7,729,993
7,213,998 7,181,273
Note: The table above includes a breakdown of sales and operating revenue to external customers by product category in the CPD and NPS segments.
The CPD and NPS segments are each managed as a single operating segment by Sony’s management.
SALES AND OPERATING REVENUE BY GEOGRAPHIC INFORMATION
Yen in millions
Years ended March 31 2009 2010 2011
Japan ...........................................................
1,873,219 2,099,297 2,152,552
........................................................................ 24.2% 29.1% 30.0%
United States . .....................................................
1,827,812 1,595,016 1,443,693
........................................................................ 23.6 22.1 20.1
Europe ...........................................................
1,987,692 1,644,698 1,539,432
........................................................................ 25.7 22.8 21.4
Asia-Pacific .......................................................
1,285,551 1,193,573 1,288,412
........................................................................ 16.6 16.6 17.9
Other Areas .......................................................
755,719 681,414 757,184
........................................................................ 9.9 9.4 10.6
Total .............................................................
7,729,993 7,213,998 7,181,273
Note: Geographic information for the fiscal years ended March 31, 2009 and 2010 in the table above has been restated to reflect the change in geographic classification.
Major areas in each geographic classification excluding Japan and U.S.A. are as follows:
(1) Europe: United Kingdom, France, Germany, Russia and Spain
(2) Asia-Pacific: China, Taiwan, India, South Korea and Oceania
(3) Other Areas: The Middle East/Africa, Brazil, Mexico and Canada
There are not any individually material countries with respect to the sales and operating revenue included in Europe, Asia-Pacific and Other Areas.
Transfers between reportable business segments or geographic areas are made at amounts which Sony’s management believes approximate arms-length transactions.
There were no sales and operating revenue with any single major external customer for the fiscal years ended March 31, 2009, 2010 and 2011.
55