Sony 2011 Annual Report Download - page 60
Download and view the complete annual report
Please find page 60 of the 2011 Sony annual report below. You can navigate through the pages in the report by either clicking on the pages listed below, or by using the keyword search tool below to find specific information within the annual report.-
 1
1 -
2
-
3
-
4
-
5
-
6
-
7
-
8
-
9
-
10
-
11
-
12
-
13
-
14
-
15
-
16
-
17
-
18
-
19
-
20
-
21
-
22
-
23
-
24
-
25
-
26
-
27
-
28
-
29
-
30
-
31
-
32
-
33
-
34
-
35
-
36
-
37
-
38
-
39
-
40
-
41
-
42
-
43
-
44
-
45
-
46
-
47
-
48
-
49
-
 50
50 -
 51
51 -
 52
52 -
 53
53 -
 54
54 -
 55
55 -
 56
56 -
 57
57 -
 58
58 -
 59
59 -
 60
60 -
 61
61 -
 62
62 -
 63
63 -
 64
64 -
 65
65 -
 66
66 -
 67
67 -
 68
68 -
 69
69 -
 70
70
 |
 |

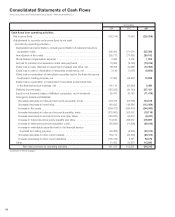
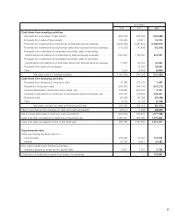
Yen in millions
2009 2010 2011
Sales and operating revenue:
Net sales .........................................................
7,110,053 6,293,005 6,304,401
Financial services revenue ............................................
523,307 838,300 798,495
Other operating revenue ..............................................
96,633 82,693 78,377
...............................................................
7,729,993 7,213,998 7,181,273
Costs and expenses:
Cost of sales ......................................................
5,660,504 4,892,563 4,831,363
Selling, general and administrative . . . . . . . . . . . . . . . . . . . . . . . . . . . . . . . . . . . . . .
1,686,030 1,544,890 1,501,813
Financial services expenses ...........................................
547,825 671,550 675,788
(Gain) loss on sale, disposal or impairment of assets and other, net . . . . . . . . . . . . .
38,308 42,988 (13,450)
...............................................................
7,932,667 7,151,991 6,995,514
Equity in net income (loss) of affiliated companies .......................
(25,109) (30,235) 14,062
Operating income (loss) ............................................
(227,783) 31,772 199,821
Other income:
Interest and dividends ...............................................
22,317 13,191 11,783
Gain on sale of securities investments, net ................................
1,281 9,953 14,325
Foreign exchange gain, net ...........................................
48,568 — 9,297
Other ............................................................
26,659 20,690 9,561
...............................................................
98,825 43,834 44,966
Other expenses:
Interest ...........................................................
24,376 22,505 23,909
Loss on devaluation of securities investments . . . . . . . . . . . . . . . . . . . . . . . . . . . . .
4,427 2,946 7,669
Foreign exchange loss, net ............................................
— 10,876 —
Other ............................................................
17,194 12,367 8,196
...............................................................
45,997 48,694 39,774
Income (loss) before income taxes ....................................
(174,955) 26,912 205,013
Income taxes:
Current ...........................................................
80,521 48,698 117,918
Deferred ..........................................................
(153,262) (34,740) 307,421
...............................................................
(72,741) 13,958 425,339
Net income (loss) ..................................................
(102,214) 12,954 (220,326)
Less—net income (loss) attributable to noncontrolling interests . . . . . . . . . . . . . . . .
(3,276) 53,756 39,259
Net loss attributable to Sony Corporation’s stockholders
......................
(98,938) (40,802) (259,585)
(Continued on following page.)
Consolidated Statements of Income
Sony Corporation and Consolidated Subsidiaries—Years ended March 31
58