Sony 2011 Annual Report Download - page 54
Download and view the complete annual report
Please find page 54 of the 2011 Sony annual report below. You can navigate through the pages in the report by either clicking on the pages listed below, or by using the keyword search tool below to find specific information within the annual report.-
 1
1 -
2
-
3
-
4
-
5
-
6
-
7
-
8
-
9
-
10
-
11
-
12
-
13
-
14
-
15
-
16
-
17
-
18
-
19
-
20
-
21
-
22
-
23
-
24
-
25
-
26
-
27
-
28
-
29
-
30
-
31
-
32
-
33
-
34
-
35
-
36
-
37
-
38
-
39
-
40
-
41
-
42
-
43
-
 44
44 -
 45
45 -
 46
46 -
 47
47 -
 48
48 -
 49
49 -
 50
50 -
 51
51 -
 52
52 -
 53
53 -
 54
54 -
 55
55 -
 56
56 -
 57
57 -
 58
58 -
 59
59 -
 60
60 -
 61
61 -
 62
62 -
 63
63 -
 64
64 -
65
-
66
-
67
-
68
-
69
-
70
 |
 |

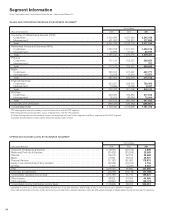
Five-Year Summary of Selected Financial Data
Sony Corporation and Consolidated Subsidiaries—Years ended March 31
Yen in millions
(Yen per share amounts)
2007 2008 2009 2010 2011
FOR THE YEAR
Sales and operating revenue . . . . . . . . . . . . . . . . .
8,295,695 8,871,414 7,729,993 7,213,998 7,181,273
Equity in net income (loss) of affiliated companies . . .
78,654 100,817 (25,109) (30,235) 14,062
Operating income (loss) . . . . . . . . . . . . . . . . . . . . .
150,404 475,299 (227,783) 31,772 199,821
Income (loss) before income taxes . . . . . . . . . . . . .
180,691 567,134 (174,955) 26,912 205,013
Income taxes .............................
53,888 203,478 (72,741) 13,958 425,339
Net income (loss) attributable to
Sony Corporation’s stockholders . . . . . . . . . . . . .
126,328 369,435 (98,938) (40,802) (259,585)
Data per share of common stock:
Net income (loss) attributable to
Sony Corporation’s stockholders
—Basic ............................
126.15 368.33 (98.59) (40.66) (258.66)
—Diluted ...........................
120.29 351.10 (98.59) (40.66) (258.66)
Cash dividends ........................
25.00 25.00 42.50 25.00 25.00
Depreciation and amortization* ................
400,009 428,010 405,443 371,004 325,366
Capital expenditures (additions to fixed assets) . . .
414,138 335,726 332,068 192,724 204,862
Research and development costs . . . . . . . . . . . . .
543,937 520,568 497,297 432,001 426,814
AT YEAR-END
Net working capital (deficit) ...................
994,871 986,296 (190,265) 72,947 (282,933)
Long-term debt ...........................
1,001,005 729,059 660,147 924,207 812,235
Sony Corporation’s stockholders’ equity .........
3,370,704 3,465,089 2,964,653 2,965,905 2,547,987
Common stock ...........................
626,907 630,576 630,765 630,822 630,921
Total assets ..............................
11,716,362 12,552,739 12,013,511 12,866,114 12,924,988
Number of shares issued at fiscal year-end
(thousands of shares of common stock) . . . . . . .
1,002,897 1,004,443 1,004,535 1,004,571 1,004,637
Sony Corporation’s stockholders’ equity per share
of common stock ........................
3,363.77 3,453.25 2,954.25 2,955.47 2,538.89
* Depreciation and amortization includes amortization expenses for intangible assets and deferred insurance acquisition costs.
52