Sony 2011 Annual Report Download - page 39
Download and view the complete annual report
Please find page 39 of the 2011 Sony annual report below. You can navigate through the pages in the report by either clicking on the pages listed below, or by using the keyword search tool below to find specific information within the annual report.-
 1
1 -
2
-
3
-
4
-
5
-
6
-
7
-
8
-
9
-
10
-
11
-
12
-
13
-
14
-
15
-
16
-
17
-
18
-
19
-
20
-
21
-
22
-
23
-
24
-
25
-
26
-
27
-
28
-
 29
29 -
 30
30 -
 31
31 -
 32
32 -
 33
33 -
 34
34 -
 35
35 -
 36
36 -
 37
37 -
 38
38 -
 39
39 -
 40
40 -
 41
41 -
 42
42 -
 43
43 -
 44
44 -
 45
45 -
 46
46 -
 47
47 -
 48
48 -
 49
49 -
50
-
51
-
52
-
53
-
54
-
55
-
56
-
57
-
58
-
59
-
60
-
61
-
62
-
63
-
64
-
65
-
66
-
67
-
68
-
69
-
70
 |
 |

37
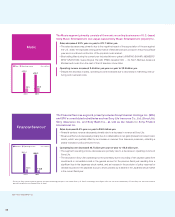
Pictures
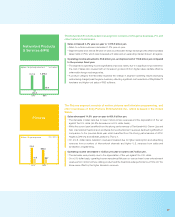
Networked Products
& Services (NPS)
(Yen in billions)
1,572.6 1,579.3
(83.3)
35.6
2010 2011
Sales Operating income (loss)
The Networked Products & Services segment consists of the game business, PC and
other network businesses.
(Yen in billions)
705.2
600.0
42.8 38.7
2010 2011
Sales Operating income
The Pictures segment consists of motion pictures and television programming, and
other businesses of Sony Pictures Entertainment Inc., which is based in the United
States.
Sales increased 0.4% year-on-year to 1,579.3 billion yen.
Sales to outside customers decreased 1.2% year-on-year.
Segment sales were almost flat year-on-year as unfavorable foreign exchange rates offset increased
sales mainly in PCs, which saw increased unit sales and an expanding market share in all regions.
Operating income amounted to 35.6 billion yen, an improvement of 118.8 billion yen compared
to the previous fiscal year.
The segment’s operating income significantly improved mainly due to a significant improvement in
the cost of sales ratio coupled with an increase in gross profit from higher sales, partially offset by
unfavorable foreign exchange rates.
A product category that favorably impacted the change in segment operating results (excluding
restructuring charges) was the game business, reflecting significant cost reductions of PlayStation®3
hardware and higher unit sales of PS3 software.
Sales decreased 14.9% year-on-year to 600.0 billion yen.
The decrease in sales was due to lower motion picture revenues and the appreciation of the yen
against the U.S. dollar (an 8% decrease on a U.S. dollar basis).
While the current year benefited from the strong performances of The Karate Kid, Grown Ups and
Salt, international theatrical and worldwide home entertainment revenues declined significantly in
comparison to the previous fiscal year which benefited from the strong performances of 2012,
Angels & Demons and Michael Jackson’s This Is It.
On a U.S. dollar basis, television revenues increased due to higher subscription and advertising
revenues from a number of international channels and higher U.S. revenues from cable and
syndication programming.
Operating income decreased 4.1 billion yen year-on-year to 38.7 billion yen.
The decrease was primarily due to the appreciation of the yen against the U.S. dollar.
On a U.S. dollar basis, operating income was almost flat year-on-year as lower home entertainment
revenues from motion picture catalog product and the theatrical underperformance of How Do You
Know were offset by the higher television revenues.