Sony 2011 Annual Report Download - page 62
Download and view the complete annual report
Please find page 62 of the 2011 Sony annual report below. You can navigate through the pages in the report by either clicking on the pages listed below, or by using the keyword search tool below to find specific information within the annual report.-
 1
1 -
2
-
3
-
4
-
5
-
6
-
7
-
8
-
9
-
10
-
11
-
12
-
13
-
14
-
15
-
16
-
17
-
18
-
19
-
20
-
21
-
22
-
23
-
24
-
25
-
26
-
27
-
28
-
29
-
30
-
31
-
32
-
33
-
34
-
35
-
36
-
37
-
38
-
39
-
40
-
41
-
42
-
43
-
44
-
45
-
46
-
47
-
48
-
49
-
50
-
51
-
 52
52 -
 53
53 -
 54
54 -
 55
55 -
 56
56 -
 57
57 -
 58
58 -
 59
59 -
 60
60 -
 61
61 -
 62
62 -
 63
63 -
 64
64 -
 65
65 -
 66
66 -
 67
67 -
 68
68 -
 69
69 -
 70
70
 |
 |

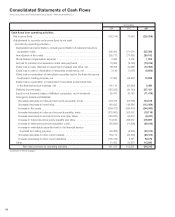
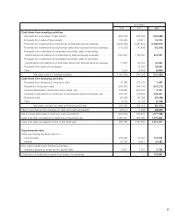
Yen in millions
2009 2010 2011
Cash flows from operating activities:
Net income (loss) .................................................
(102,214) 12,954 (220,326)
Adjustments to reconcile net income (loss) to net cash
provided by operating activities—
Depreciation and amortization, including amortization of deferred insurance
acquisition costs ...............................................
405,443 371,004 325,366
Amortization of film costs ..........................................
255,713 277,665 250,192
Stock-based compensation expense . . . . . . . . . . . . . . . . . . . . . . . . . . . . . . . .
3,446 2,202 1,952
Accrual for pension and severance costs, less payments . . . . . . . . . . . . . . . . .
16,654 (9,763) (15,229)
(Gain) loss on sale, disposal or impairment of assets and other, net ..........
38,308 42,988 (13,450)
(Gain) loss on sale or devaluation of securities investments, net . . . . . . . . . . . .
3,146 (7,007) (6,656)
(Gain) loss on revaluation of marketable securities held in the financial service
business for trading purpose, net . . . . . . . . . . . . . . . . . . . . . . . . . . . . . . . . . .
77,952 (49,837) 10,958
(Gain) loss on revaluation or impairment of securities investments held
in the financial service business, net . . . . . . . . . . . . . . . . . . . . . . . . . . . . . . . .
101,114 (53,984) 5,080
Deferred income taxes ............................................
(153,262) (34,740) 307,421
Equity in net (income) losses of affiliated companies, net of dividends . . . . . . . .
65,470 36,183 (11,479)
Changes in assets and liabilities:
(Increase) decrease in notes and accounts receivable, trade . . . . . . . . . . . . .
218,168 (53,306) 104,515
(Increase) decrease in inventories ..................................
160,432 148,584 (112,089)
Increase in film costs ...........................................
(264,412) (296,819) (244,063)
Increase (decrease) in notes and accounts payable, trade . . . . . . . . . . . . . . .
(375,842) 262,032 (18,119)
Increase (decrease) in accrued income and other taxes . . . . . . . . . . . . . . . . .
(163,200) 63,619 (8,020)
Increase in future insurance policy benefits and other ...................
174,549 284,972 278,897
Increase in deferred insurance acquisition costs .......................
(68,666) (71,999) (69,196)
Increase in marketable securities held in the financial service
business for trading purpose . . . . . . . . . . . . . . . . . . . . . . . . . . . . . . . . . . . .
(26,088) (8,335) (30,102)
(Increase) decrease in other current assets ...........................
134,175 (32,405) (89,473)
Increase (decrease) in other current liabilities . . . . . . . . . . . . . . . . . . . . . . . . .
(105,155) 5,321 56,076
Other .........................................................
11,422 23,578 113,990
Net cash provided by operating activities. . . . . . . . . . . . . . . . . . . . . . . . .
407,153 912,907 616,245
(Continued on following page.)
Consolidated Statements of Cash Flows
Sony Corporation and Consolidated Subsidiaries—Years ended March 31
60