Sony 2011 Annual Report Download - page 56
Download and view the complete annual report
Please find page 56 of the 2011 Sony annual report below. You can navigate through the pages in the report by either clicking on the pages listed below, or by using the keyword search tool below to find specific information within the annual report.-
 1
1 -
2
-
3
-
4
-
5
-
6
-
7
-
8
-
9
-
10
-
11
-
12
-
13
-
14
-
15
-
16
-
17
-
18
-
19
-
20
-
21
-
22
-
23
-
24
-
25
-
26
-
27
-
28
-
29
-
30
-
31
-
32
-
33
-
34
-
35
-
36
-
37
-
38
-
39
-
40
-
41
-
42
-
43
-
44
-
45
-
 46
46 -
 47
47 -
 48
48 -
 49
49 -
 50
50 -
 51
51 -
 52
52 -
 53
53 -
 54
54 -
 55
55 -
 56
56 -
 57
57 -
 58
58 -
 59
59 -
 60
60 -
 61
61 -
 62
62 -
 63
63 -
 64
64 -
 65
65 -
 66
66 -
67
-
68
-
69
-
70
 |
 |

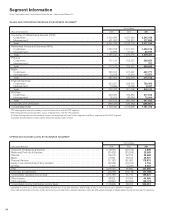
SALES AND OPERATING REVENUE BY BUSINESS SEGMENT*
Yen in millions
Years ended March 31 2009 2010 2011
Consumer, Professional & Devices (CPD)
Customers .............................................................
3,926,386 3,207,546 3,345,048
Intersegment ...........................................................
431,363 310,573 227,696
Total ..................................................................
4,357,749 3,518,119 3,572,744
Networked Products & Services (NPS)
Customers .............................................................
1,684,758 1,511,575 1,493,136
Intersegment ...........................................................
70,885 61,041 86,195
Total ..................................................................
1,755,643 1,572,616 1,579,331
Pictures
Customers .............................................................
717,513 705,237 599,654
Intersegment ...........................................................
— — 312
Total ..................................................................
717,513 705,237 599,966
Music
Customers .............................................................
363,074 511,097 457,771
Intersegment ...........................................................
23,979 11,519 12,972
Total ..................................................................
387,053 522,616 470,743
Financial Services
Customers .............................................................
523,307 838,300 798,495
Intersegment ...........................................................
14,899 13,096 8,031
Total ..................................................................
538,206 851,396 806,526
All Other
Customers .............................................................
453,603 379,862 377,816
Intersegment ...........................................................
76,523 80,904 70,004
Total ..................................................................
530,126 460,766 447,820
Corporate and elimination ..................................................
(556,297) (416,752) (295,857)
Consolidated total ........................................................
7,729,993 7,213,998 7,181,273
* CPD intersegment amounts primarily consist of transactions with the NPS segment.
NPS intersegment amounts primarily consist of transactions with the CPD segment.
All Other intersegment amounts primarily consist of transactions with the Pictures segment, the Music segment and the NPS segment.
Corporate and elimination includes certain brand and patent royalty income.
Segment Information
Sony Corporation and Consolidated Subsidiaries—Years ended March 31
OPERATING INCOME (LOSS) BY BUSINESS SEGMENT*
Yen in millions
Years ended March 31 2009 2010 2011
Consumer, Professional & Devices
. . . . . . . . . . . . . . . . . . . . . . . . . . . . . . . . . . . . . . . . . . . . . .
(115,571) (53,174) 2,898
Networked Products & Services
...............................................
(87,428) (83,265) 35,569
Pictures
..................................................................
29,916 42,814 38,669
Music
....................................................................
27,843 36,513 38,927
Financial Services
..........................................................
(31,157) 162,492 118,818
Equity in net income (loss) of Sony Ericsson
......................................
(30,255) (34,514) 4,155
All Other
..................................................................
3,105 (4,976) 8,554
Total
.....................................................................
(203,547) 65,890 247,590
Corporate and elimination
....................................................
(24,236) (34,118) (47,769)
Consolidated operating income (loss)
...........................................
(227,783) 31,772 199,821
Other income
..............................................................
98,825 43,834 44,966
Other expenses
............................................................
(45,997) (48,694) (39,774)
Consolidated income (loss) before income taxes
...................................
(174,955) 26,912 205,013
* Operating income (loss) is Sales and operating revenue less Costs and expenses, and includes Equity in net income (loss) of affiliated companies.
Corporate and elimination includes certain restructuring costs and other corporate expenses, which are attributable principally to headquarters and are not allocated to segments.
54