Sony 2011 Annual Report Download - page 40
Download and view the complete annual report
Please find page 40 of the 2011 Sony annual report below. You can navigate through the pages in the report by either clicking on the pages listed below, or by using the keyword search tool below to find specific information within the annual report.-
 1
1 -
2
-
3
-
4
-
5
-
6
-
7
-
8
-
9
-
10
-
11
-
12
-
13
-
14
-
15
-
16
-
17
-
18
-
19
-
20
-
21
-
22
-
23
-
24
-
25
-
26
-
27
-
28
-
29
-
 30
30 -
 31
31 -
 32
32 -
 33
33 -
 34
34 -
 35
35 -
 36
36 -
 37
37 -
 38
38 -
 39
39 -
 40
40 -
 41
41 -
 42
42 -
 43
43 -
 44
44 -
 45
45 -
 46
46 -
 47
47 -
 48
48 -
 49
49 -
 50
50 -
51
-
52
-
53
-
54
-
55
-
56
-
57
-
58
-
59
-
60
-
61
-
62
-
63
-
64
-
65
-
66
-
67
-
68
-
69
-
70
 |
 |

38
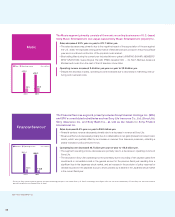
Music
Financial Services*
(Yen in billions)
522.6
470.7
36.5 38.9
2010 2011
Sales Operating income
The Music segment primarily consists of the music recording businesses of U.S.-based
Sony Music Entertainment and Japan-based Sony Music Entertainment (Japan) Inc.
(Yen in billions)
806.5
851.4
162.5 118.8
2010 2011
Revenue Operating income
The Financial Services segment primarily includes Sony Financial Holdings Inc. (SFH)
and SFH’s consolidated subsidiaries such as Sony Life Insurance Co., Ltd. (Sony Life),
Sony Assurance Inc. and Sony Bank Inc., as well as the results for Sony Finance
International Inc.
Sales decreased 9.9% year-on-year to 470.7 billion yen.
The sales decrease was primarily due to the negative impact of the appreciation of the yen against
the U.S. dollar, the especially strong performance of Michael Jackson product in the previous fiscal
year and a continued contraction of the physical music market.
Best-selling titles during the current year included ikimono-gakari’s IKIMONO BAKARI: MEMBERS’
BEST SELECTION, Susan Boyle’s The Gift, P!NK’s Greatest Hits … So Far!!!, Michael Jackson’s
Michael and music from the cast of the hit television show Glee.
Operating income increased 2.4 billion yen year-on-year to 38.9 billion yen.
Despite the decrease in sales, operating income increased due to decreases in marketing, restruc-
turing and overhead costs.
Sales decreased 5.3% year-on-year to 806.5 billion yen.
Financial services revenue decreased primarily due to a decrease in revenue at Sony Life.
Revenue at Sony Life decreased primarily due to a deterioration in net gains (losses) from asset invest-
ments, which was partially offset by an increase in revenue from insurance premiums, reflecting a
steady increase in policy amount in force.
Operating income decreased 43.7 billion yen year-on-year to 118.8 billion yen.
The segment operating income decrease was primarily due to a decrease in operating income at
Sony Life.
The decrease in Sony Life’s operating income was mainly due to recording of net valuation gains from
investments in convertible bonds in the general account in the previous fiscal year resulting from a
significant rise in the Japanese stock market, and an increase in the provision of policy reserves for
variable insurance in the separate account, driven primarily by a decline in the Japanese stock market
in the current fiscal year.
* Results for Sony Life are based on generally accepted accounting principles in the United States (U.S. GAAP). Accordingly, these figures differ from the results published by SFH and Sony Life, which are based on
generally accepted accounting principles in Japan.
Note: Years ended March 31.