Sony 2011 Annual Report Download - page 63
Download and view the complete annual report
Please find page 63 of the 2011 Sony annual report below. You can navigate through the pages in the report by either clicking on the pages listed below, or by using the keyword search tool below to find specific information within the annual report.-
 1
1 -
2
-
3
-
4
-
5
-
6
-
7
-
8
-
9
-
10
-
11
-
12
-
13
-
14
-
15
-
16
-
17
-
18
-
19
-
20
-
21
-
22
-
23
-
24
-
25
-
26
-
27
-
28
-
29
-
30
-
31
-
32
-
33
-
34
-
35
-
36
-
37
-
38
-
39
-
40
-
41
-
42
-
43
-
44
-
45
-
46
-
47
-
48
-
49
-
50
-
51
-
52
-
 53
53 -
 54
54 -
 55
55 -
 56
56 -
 57
57 -
 58
58 -
 59
59 -
 60
60 -
 61
61 -
 62
62 -
 63
63 -
 64
64 -
 65
65 -
 66
66 -
 67
67 -
 68
68 -
 69
69 -
 70
70
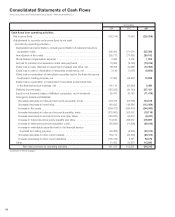
 |
 |

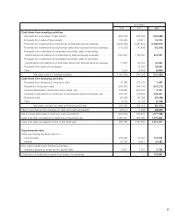
Yen in millions
2009 2010 2011
Cash flows from investing activities:
Payments for purchases of fixed assets .................................
(496,125) (338,050) (253,688)
Proceeds from sales of fixed assets . . . . . . . . . . . . . . . . . . . . . . . . . . . . . . . . . . .
153,439 15,671 18,743
Payments for investments and advances by financial service business .........
(2,496,783) (1,581,841) (1,458,912)
Payments for investments and advances (other than financial service business) ...
(178,335) (41,838) (15,316)
Proceeds from maturities of marketable securities, sales of securities
investments and collections of advances by financial service business ..........
1,923,264 1,128,500 874,031
Proceeds from maturities of marketable securities, sales of securities
investments and collections of advances (other than financial service business) ...
11,569 54,324 30,332
Proceeds from sales of businesses ....................................
— 22,084 99,335
Other ..........................................................
1,629 (4,854) (8,964)
Net cash used in investing activities .............................
(1,081,342) (746,004) (714,439)
Cash flows from financing activities:
Proceeds from issuance of long-term debt . . . . . . . . . . . . . . . . . . . . . . . . . . . . . .
72,188 510,128 1,499
Payments of long-term debt .........................................
(264,467) (144,105) (216,212)
Increase (decrease) in short-term borrowings, net .........................
244,584 (250,252) 6,120
Increase in deposits from customers in the financial service business, net .......
261,619 276,454 229,327
Dividends paid ...................................................
(42,594) (25,085) (25,098)
Other .........................................................
(3,872) (2,126) (5,748)
Net cash provided by (used in) financing activities ..................
267,458 365,014 (10,112)
Effect of exchange rate changes on cash and cash equivalents . . . . . . . . . . . . . . . .
(18,911) (1,098) (68,890)
Net increase (decrease) in cash and cash equivalents . . . . . . . . . . . . . . . . . . . . . . .
(425,642) 530,819 (177,196)
Cash and cash equivalents at beginning of the fiscal year . . . . . . . . . . . . . . . . . . . .
1,086,431 660,789 1,191,608
Cash and cash equivalents at end of the fiscal year . . . . . . . . . . . . . . . . . . . . . . . . .
660,789 1,191,608 1,014,412
Supplemental data:
Cash paid during the fiscal year for—
Income taxes ....................................................
242,528 60,022 116,376
Interest ........................................................
22,729 19,821 20,583
Non-cash investing and financing activities—
Obtaining assets by entering into capital lease . . . . . . . . . . . . . . . . . . . . . . . . . . .
5,831 2,553 3,738
Collections of deferred proceeds from sales of receivables .................... — —
153,550
61