Sysco 2015 Annual Report Download - page 11
Download and view the complete annual report
Please find page 11 of the 2015 Sysco annual report below. You can navigate through the pages in the report by either clicking on the pages listed below, or by using the keyword search tool below to find specific information within the annual report.-
 1
1 -
 2
2 -
 3
3 -
 4
4 -
 5
5 -
 6
6 -
 7
7 -
 8
8 -
 9
9 -
 10
10 -
 11
11 -
 12
12 -
 13
13 -
 14
14 -
 15
15 -
 16
16 -
 17
17 -
 18
18 -
 19
19 -
 20
20 -
 21
21 -
 22
22 -
23
-
24
-
25
-
26
-
27
-
28
-
29
-
30
-
31
-
32
-
33
-
34
-
35
-
36
-
37
-
38
-
39
-
40
-
41
-
42
-
43
-
44
-
45
-
46
-
47
-
48
-
49
-
50
-
51
-
52
-
53
-
54
-
55
-
56
-
57
-
58
-
59
-
60
-
61
-
62
-
63
-
64
-
65
-
66
-
67
-
68
-
69
-
70
-
71
-
72
-
73
-
74
-
75
-
76
-
77
-
78
-
79
-
80
-
81
-
82
-
83
-
84
-
85
-
86
-
87
-
88
-
89
-
90
-
91
-
92
-
93
-
94
-
95
-
96
-
97
-
98
-
99
-
100
 |
 |

SYSCO CORPORATION-Form10-K 3
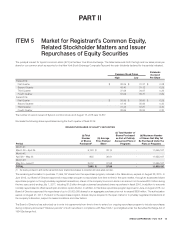
PARTI
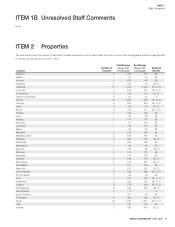
ITEM1Business
Sources of Supply
We purchase from thousands of suppliers, both domestic and international, none of which individually accounts for more than 10% of our purchases.
These suppliers consist generally of large corporations selling brand name and private label merchandise, as well as independent regional brand and private
label processors and packers. Purchasing is generally carried out through both centrally developed purchasing programs and direct purchasing programs
established by our various operating companies.
We administer a consolidated product procurement program designed to develop, obtain and ensure consistent quality food and non-food products. The
program covers the purchasing and marketing of Sysco Brand merchandise, as well as products from a number of national brand suppliers, encompassing
substantially all product lines. Sysco’s operating companies purchase product from the suppliers participating in these consolidated programs and from
other suppliers, although Sysco Brand products are only available to the operating companies through these consolidated programs. We also focus on
increasing pro tability by lowering operating costs and by lowering aggregate inventory levels, which reduces future facility expansion needs at our broadline
operating companies, while providing greater value to our suppliers and customers. This includes the construction and operation of regional distribution
centers (RDCs), which aggregate inventory demand to optimize the supply chain activities for certain products for all Sysco broadline operating companies
in the region. Currently, we have two RDCs in operation, one in Virginia and one in Florida.
Working Capital Practices
Our growth is funded through a combination of cash ow from operations, commercial paper issuances and long-term borrowings. See the discussion in
“Management’s Discussion and Analysis of Financial Condition and Results of Operations, Liquidity and Capital Resources” in Item 7 regarding our liquidity,
nancial position and sources and uses of funds.
Credit terms we extend to our customers can vary from cash on delivery to 30 days or more based on our assessment of each customer’s credit worthiness.
We monitor each customer’s account and will suspend shipments if necessary.
A majority of our sales orders are lled within 24 hours of when customer orders are placed. We generally maintain inventory on hand to be able to meet
customer demand. The level of inventory on hand will vary by product depending on shelf-life, supplier order ful llment lead times and customer demand.
We also make purchases of additional volumes of certain products based on supply or pricing opportunities.
We take advantage of suppliers’ cash discounts where appropriate and otherwise generally receive payment terms from our suppliers ranging from weekly
to 30 days or more.
Corporate Headquarters and Shared Services Center
Our corporate staff makes available a number of services to our operating companies and our shared services center performs support services for
employees, suppliers and customers. Members of these groups possess experience and expertise in, among other areas, customer and vendor contract
administration, vendor payments, procurement and maintenance support, invoicing, cash application, accounting and nance, treasury, credit services,
legal, cash management, information technology, employee bene ts, engineering, real estate and construction, risk management and insurance, sales
and marketing, payroll, human resources, training and development, strategy, and tax compliance services, including sales and use tax administration.
The corporate of ce also makes available warehousing and distribution services, which provide assistance in operational best practices including space
utilization, energy conservation, eet management and work ow.
Capital Improvements
To maximize productivity and customer service, we continue to modernize, expand and construct new distribution facilities. During scal 2015, 2014
and 2013, approximately $542.8 million, $523.2 million and $511.9 million, respectively, were invested in delivery eet, facilities, technology and other
capital asset enhancements. From time to time, we dispose of assets in the normal course of business; we consider proceeds from these asset sales to
be an offset to capital expenditures. During scal 2015, 2014 and 2013, capital expenditures, net of proceeds from sales of assets, were $518.4million,
$497.4million and $496.3 million, respectively. We estimate our capital expenditures, net of proceeds from sales of assets, in scal 2016 should be in the
range of $550 million to $600 million. During the three years ended June 27, 2015, capital expenditures were nanced primarily by internally generated
funds, our commercial paper program and bank and other borrowings. We expect to nance our scal 2016 capital expenditures from the same sources.