Sysco 2015 Annual Report Download - page 38
Download and view the complete annual report
Please find page 38 of the 2015 Sysco annual report below. You can navigate through the pages in the report by either clicking on the pages listed below, or by using the keyword search tool below to find specific information within the annual report.-
 1
1 -
2
-
3
-
4
-
5
-
6
-
7
-
8
-
9
-
10
-
11
-
12
-
13
-
14
-
15
-
16
-
17
-
18
-
19
-
20
-
21
-
22
-
23
-
24
-
25
-
26
-
27
-
 28
28 -
 29
29 -
 30
30 -
 31
31 -
 32
32 -
 33
33 -
 34
34 -
 35
35 -
 36
36 -
 37
37 -
 38
38 -
 39
39 -
 40
40 -
 41
41 -
 42
42 -
 43
43 -
 44
44 -
 45
45 -
 46
46 -
 47
47 -
 48
48 -
49
-
50
-
51
-
52
-
53
-
54
-
55
-
56
-
57
-
58
-
59
-
60
-
61
-
62
-
63
-
64
-
65
-
66
-
67
-
68
-
69
-
70
-
71
-
72
-
73
-
74
-
75
-
76
-
77
-
78
-
79
-
80
-
81
-
82
-
83
-
84
-
85
-
86
-
87
-
88
-
89
-
90
-
91
-
92
-
93
-
94
-
95
-
96
-
97
-
98
-
99
-
100
 |
 |
SYSCO CORPORATION-Form10-K30
PARTII
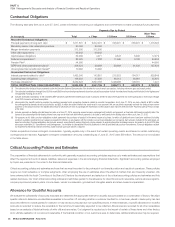
ITEM7Management’s Discussion and Analysis ofFinancial Condition and Results of Operations
Any remaining cash generated from operations may be invested in high-quality, short-term instruments. As a part of our ongoing strategic analysis,
we regularly evaluate business opportunities, including potential acquisitions and sales of assets and businesses, and our overall capital structure. Any
transactions resulting from these evaluations may materially impact our liquidity, borrowing capacity, leverage ratios and capital availability.
We continue to generate substantial cash ows from operations and remain in a strong nancial position; however, our liquidity and capital resources can
be in uenced by economic trends and conditions that impact our results of operations. We believe our mechanisms to manage working capital, such as
credit monitoring, optimizing inventory levels and maximizing payment terms with vendors, and our mechanisms to manage the items impacting our gross
pro ts have been suf cient to limit a signi cant unfavorable impact on our cash ows from operations. We believe these mechanisms will continue to prevent
a signi cant unfavorable impact on our cash ows from operations. As of June 27, 2015, we had $5.1 billion in cash and cash equivalents, approximately
4% of which was held by our international subsidiaries generated from our earnings of international operations. This percentage is lower than previous
years because of proceeds from our senior notes offering, which we borrowed to fund the then proposed US Foods merger. Since the senior notes were
redeemed subsequent to June 27, 2015, due to the termination of the merger agreement, we would expect this percentage to return to historical levels,
such as 32%, which was the percentage as of June 28, 2014. If these earnings were transferred among countries or repatriated to the U.S., such amounts
may be subject to additional tax obligations; however, we do not currently anticipate the need to repatriate this cash.
We believe the following sources will be suf cient to meet our anticipated cash requirements for the next twelve months, while maintaining suf cient liquidity
for normal operating purposes:
•our cash ows from operations;
•
the availability of additional capital under our existing commercial paper programs, supported by our revolving credit facility and bank line of credit; and
•our ability to access capital from nancial markets, including issuances of debt securities, either privately or under a shelf registration statement to be
led with the Securities and Exchange Commission (SEC) in the rst quarter of scal 2016.
Due to our strong nancial position, we believe that we will continue to be able to effectively access the commercial paper market and long-term capital
markets, if necessary.
Cash Flows
Operating Activities
Fiscal 2015 vs. Fiscal 2014
We generated $1.6 billion in cash ow from operations in scal 2015, as compared to $1.5 billion in scal 2014. This increase of $62.7 million, or 4.2%,
was largely attributable to favorable comparisons on accrued expenses, partially offset by unfavorable comparisons on the cash impact of our Certain
Items that increased $148.9 million year-over-year. Other unfavorable comparisons were a decrease in other long-term liabilities and the impact of timing
for pension contributions, as well as increased working capital needs.
Included in the change in accrued expenses was a favorable comparison of incentive accruals due to better performance against incentive targets in
scal 2015. Our Certain Items increased primarily from integration planning, litigation and termination costs in connection with the merger that had been
proposed with US Foods. Our merger termination fees of $312.5 million, payable to US Foods and PFG, were accrued as of June 27, 2015, and were
paid in the July 2015.
Included in the change in other long-term liabilities was a negative comparison on pension expense and contributions, which contributed
$90.4 million to the unfavorable comparison on cash ow from operations for scal 2015 to scal 2014. Pension income was $15.3 million and
pension contributions were $75.1 million, including a $50 million contribution to our Retirement Plan in scal 2015, which resulted in a decrease
to other long-term liabilities. Pension expense was $4.8 million and pension contributions were $24.8 million in scal 2014, which resulted in a
decrease to other long-term liabilities.
Changes in working capital, speci cally accounts receivable, inventory and accounts payable, had a net unfavorable comparison of $25.0 million on the
comparison of cash ow from operations for scal 2015 to scal 2014. There was a favorable comparison on inventory and accounts receivable, which
was partially offset by unfavorable comparisons on accounts payable. Accounts receivable increased in both periods as a result of increases in sales;
however, the level of increase in scal 2015 was less than scal 2014 due to improved collection efforts. Inventory increased in both periods as a result
of increases in sales. However, inventory turnover improved in scal 2015, as compared to scal 2014. Accounts payable increased in both periods as
a result of increases in sales. The year-over-year impact of the change in accounts payable is unfavorable to cash ow from operations due to working
capital improvements that were at a greater magnitude in scal 2014 as compared to scal 2015.