Sysco 2015 Annual Report Download - page 36
Download and view the complete annual report
Please find page 36 of the 2015 Sysco annual report below. You can navigate through the pages in the report by either clicking on the pages listed below, or by using the keyword search tool below to find specific information within the annual report.-
 1
1 -
2
-
3
-
4
-
5
-
6
-
7
-
8
-
9
-
10
-
11
-
12
-
13
-
14
-
15
-
16
-
17
-
18
-
19
-
20
-
21
-
22
-
23
-
24
-
25
-
 26
26 -
 27
27 -
 28
28 -
 29
29 -
 30
30 -
 31
31 -
 32
32 -
 33
33 -
 34
34 -
 35
35 -
 36
36 -
 37
37 -
 38
38 -
 39
39 -
 40
40 -
 41
41 -
 42
42 -
 43
43 -
 44
44 -
 45
45 -
 46
46 -
47
-
48
-
49
-
50
-
51
-
52
-
53
-
54
-
55
-
56
-
57
-
58
-
59
-
60
-
61
-
62
-
63
-
64
-
65
-
66
-
67
-
68
-
69
-
70
-
71
-
72
-
73
-
74
-
75
-
76
-
77
-
78
-
79
-
80
-
81
-
82
-
83
-
84
-
85
-
86
-
87
-
88
-
89
-
90
-
91
-
92
-
93
-
94
-
95
-
96
-
97
-
98
-
99
-
100
 |
 |
SYSCO CORPORATION-Form10-K28
PARTII
ITEM7Management’s Discussion and Analysis ofFinancial Condition and Results of Operations
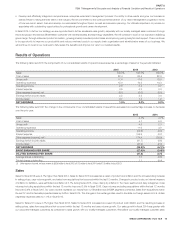
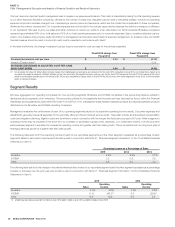
Operating expenses for the Broadline segment increased in scal 2015 as compared to scal 2014. The increase in expenses for scal 2015 as compared
to scal 2014 was driven largely by higher sales costs, increased expense related to management incentive accruals and costs from companies acquired
within the last 12 months. Partially offsetting these increases were decreases in fuel costs. Sales and gross pro t growth partially contributed to an increase
in sales pay-related expenses due to increases in sales commissions and bonuses. In addition, we have increased our marketing associate headcount in
certain markets in order to invest in future sales growth. Our cost per case and adjusted cost per case increased $0.04 per case in scal 2015 as compared
to scal 2014. The impact of foreign exchange rates lowered our cost per case results by $0.05 per case for scal 2015 as compared to scal 2014, which
partially offset the rate of increase occurring primarily from increased pay-related expenses partially offset by lower fuel costs.
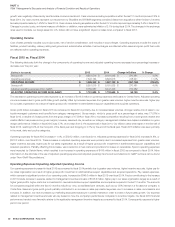
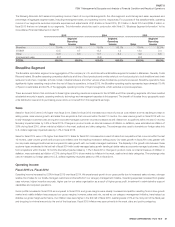
Fiscal 2014 vs. Fiscal 2013
Operating income increased by 2.8% in scal 2014 from scal 2013. This increase was driven by operating expenses increasing more than gross pro t dollars.
Gross pro t dollars increased in scal 2014 primarily due to increased sales; however, gross pro t dollars increased at a lower rate than sales. This decline
in gross margin was partially the result of increased in ation, increased growth from corporate-managed customers and, in part, from our Business
Transformation Project Initiative. Increased competition resulting from a slow-growth market also contributed to the decline in gross margins. Our Broadline
segment experienced product cost in ation in scal 2014. Based on our product sales mix during scal 2014, we were most impacted by higher levels of
in ation in the poultry and meat product categories.
Operating expenses for the Broadline segment increased in scal 2014 as compared to scal 2013. The expense increases in scal 2014 were driven largely
by charges related to multiemployer pension plan withdrawals, pay-related expenses including severance costs, depreciation and amortization expense and
fuel. The increase in pay-related expenses was primarily due to increased delivery and warehouse compensation, partially attributable to case growth, and
added costs from companies acquired in the last 12 months. Delivery and warehouse compensation includes activity-based pay that will increase when
our case volumes increase. Additionally, pay rates have been higher particularly in geographies where oil and gas exploration occurs. These increases were
partially offset by reduced sales and information technology pay-related expenses. Our enhanced de ned contribution plan became effective January 1,
2013 and contributed to the increase in operating expenses. Depreciation and amortization increased primarily from assets that were not placed in service
in scal 2013 that were in service in scal 2014, primarily from new facilities, property from new acquisitions and expansions.
In scal 2014 and scal 2013, we recorded provisions of $1.5 million and $41.9 million, respectively, related to multiemployer pension plan withdrawals.
Our scal 2014 cost per case, excluding charges related to withdrawals from multiemployer pension plans, decreased as compared to scal 2013 primarily
from reduced pay-related expenses from our sales and information technology areas, partially offset by increased costs from delivery and warehouse pay-
related expenses, increased retirement-related expenses and fuel increases.
SYGMA Segment
SYGMA operating companies distribute a full line of food products, a wide variety of non-food products and customer-speci c proprietary products to
certain chain restaurant customer locations. SYGMA operations have traditionally had lower operating income as a percentage of sales than Sysco’s
other segments. This segment of the foodservice industry has generally been characterized by lower overall operating margins as the volume that these
customers command allows them to negotiate for reduced margins. These operations service chain restaurants through contractual agreements that are
typically structured on a fee per case delivered basis.
Sales
Sales were 1.6% lower in scal 2015 than in scal 2014. The decrease was primarily due to the resignation of several unpro table accounts, lost customers
and lower fuel surcharges. Partially offsetting these decreases were increases from product cost in ation (and the resulting increase in selling prices) and
case volume increases from existing customers. We expect similar sales results in scal 2016 due to the continued impact of these resignations, as well
as competitive pricing pressures. SYGMA intends to add business with new and existing customers to pro tably grow this segment’s results.
Sales were 6.9% greater in scal 2014 than in scal 2013. The increase was primarily due to new customers. Other contributors to the increase were
product cost in ation and the resulting increase in selling prices and case volume increases from existing customers.
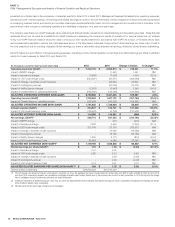
Operating Income
Operating income decreased by 46.1% in scal 2015 from scal 2014. Gross pro t dollars decreased 3.3% while operating expenses increased 7.3% in
scal 2015 over scal 2014. Gross pro t dollar growth was lower primarily due to reduced fuel surcharges and lower margins as a result of the competitive
market environment. Operating expenses increased in scal 2015 largely due to increased warehouse and delivery costs, including pay-related expenses,
partially resulting from efforts to increase driver retention and manage warehouse employee shortages. Operating income is expected to improve in scal2016
as compared to scal 2015 due to improved pro tability from resigning less pro table customers and improved productivity.