Sysco 2015 Annual Report Download - page 24
Download and view the complete annual report
Please find page 24 of the 2015 Sysco annual report below. You can navigate through the pages in the report by either clicking on the pages listed below, or by using the keyword search tool below to find specific information within the annual report.-
 1
1 -
2
-
3
-
4
-
5
-
6
-
7
-
8
-
9
-
10
-
11
-
12
-
13
-
 14
14 -
 15
15 -
 16
16 -
 17
17 -
 18
18 -
 19
19 -
 20
20 -
 21
21 -
 22
22 -
 23
23 -
 24
24 -
 25
25 -
 26
26 -
 27
27 -
 28
28 -
 29
29 -
 30
30 -
 31
31 -
 32
32 -
 33
33 -
 34
34 -
35
-
36
-
37
-
38
-
39
-
40
-
41
-
42
-
43
-
44
-
45
-
46
-
47
-
48
-
49
-
50
-
51
-
52
-
53
-
54
-
55
-
56
-
57
-
58
-
59
-
60
-
61
-
62
-
63
-
64
-
65
-
66
-
67
-
68
-
69
-
70
-
71
-
72
-
73
-
74
-
75
-
76
-
77
-
78
-
79
-
80
-
81
-
82
-
83
-
84
-
85
-
86
-
87
-
88
-
89
-
90
-
91
-
92
-
93
-
94
-
95
-
96
-
97
-
98
-
99
-
100
 |
 |

SYSCO CORPORATION-Form10-K16
PARTII
ITEM7Management’s Discussion and Analysis ofFinancial Condition and Results of Operations
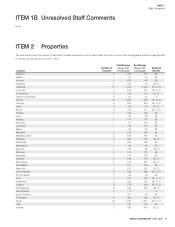
We consider our primary market to be the foodservice market in the U.S., Canada and Ireland and estimate that we serve about 17.7% of this approximately
$264 billion annual market based on a measurement as of the end of calendar 2014. We use industry data obtained from various sources including Technomic,
Inc., the Canadian Restaurant and Foodservices Association and the Irish Food Board to calculate this measurement. According to industry sources, the
foodservice, or food-away-from-home, market represents approximately 48% of the total dollars spent on food purchases made at the consumer level
in the U.S. as of the end of calendar 2014.
Industry sources estimate the total foodservice market in the U.S. experienced a real sales increase of approximately 0.7% in calendar year 2014 and 1.1%
in calendar year 2013. Real sales changes do not include the impact of in ation or de ation.
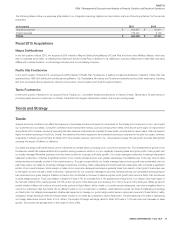
Highlights
The foodservice industry performance in scal 2015 was generally improved. Consumer con dence and the outlook of foodservice operators are at high
levels, but have decreased slightly in the summer months of 2015. Fuel prices declined during scal 2015 and are currently at lower levels, as compared
to recent years, that may support higher consumer spending in the future. Spending at restaurants is generally improved, but customer traf c levels are
generally unchanged. Overall, the market environment appears to be modestly improved as compared to the prior two years; however, uncertainty in
industry growth remains for scal 2016. Amid these conditions, we provided our customers with excellent service, growing our business with both our
locally and corporate managed customers and stabilizing our gross margins by successfully implementing several value-added commercial initiatives. We
improved our expense management performance as the year progressed, achieving greater success managing expenses in the second half of the year
as compared to the rst half. The impact of Certain Items contributed to lower earnings in scal 2015 as compared to scal 2014, primarily from the costs
associated with the merger that had been proposed with US Foods.
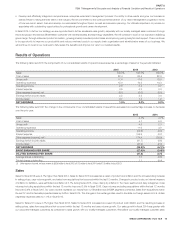
Comparison of results from scal 2015 to scal 2014:
•Sales increased 4.7%, or $2.2 billion to $48.7 billion;
•Gross pro t increased 4.5%, or $370.5 million to $8.6 billion;
•Operating income decreased 22.5%, or $0.4 billion, to $1.2 billion;
•Adjusted operating income increased 3.4%, or $58.2 million, to $1.8 billion;
•Net earnings decreased 26.3%, or $244.8 million, to $0.7 billion;
•Adjusted net earnings increased 6.4%, or $66.3 million, to $1.1 billion;
•
Basic earnings per share in scal 2015 was $1.16, a 27% decrease from the comparable prior year period amount of $1.59 per share. Diluted earnings
per share in scal 2015 was $1.15, a 27.2% decrease from the comparable prior year period amount of $1.58 per share; and
•Adjusted diluted earnings per share was $1.84 in scal 2015, a 5.1% increase from the comparable prior year amount of $1.75 per share.
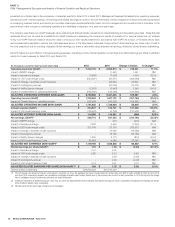
See “Non-GAAP Reconciliations” for an explanation of these non-GAAP nancial measures.
Business Transformation
In scal 2015, we completed the three-year nancial objectives of our Business Transformation. These nancial objectives were largely designed to lower
our product cost and lower our operating cost structure. We implemented a category management program to leverage our scale and develop deeper,
more strategic relationships with our suppliers to drive growth and innovation. We also implemented multiple initiatives to lower our operating cost structure
including a more streamlined and standard approach to the management of eet, labor, maintenance, procurement and supplies. Our goal for the project
was to generate approximately $550 million to $650 million in annual bene ts to be achieved by scal 2015. We exceeded our nal three-year target for
annualized bene ts.
US Foods Merger Termination
We sought to merge with US Foods, a leading foodservice distributor in the U.S. The merger was reviewed by the Federal Trade Commission (FTC) and in
February 2015, the FTC commissioners voted 3 to 2 to authorize the FTC staff to seek a preliminary injunction from the U.S. District Court for the District of
Columbia preventing the parties from closing the merger. In June 2015, the preliminary injunction was granted. Shortly thereafter, the parties involved agreed
to terminate the merger agreement, as a result of which Sysco was obligated to pay $300 million to the owners of US Foods. During the review period with
the FTC, Sysco created a divestiture package, comprised of the sale of 11 US Foods facilities to Performance Food Group (PFG), which was contingent
on the closing of the merger. This divestiture agreement entitled PFG to receive a $25 million termination fee if the sale of the divestiture package was
terminated before July 6, 2015, with each of Sysco and US Foods responsible for one half of the applicable fee. Sysco accrued for termination payments
totaling $312.5 million in scal 2015 and paid these amounts in scal 2016.