Sysco 2015 Annual Report Download - page 74
Download and view the complete annual report
Please find page 74 of the 2015 Sysco annual report below. You can navigate through the pages in the report by either clicking on the pages listed below, or by using the keyword search tool below to find specific information within the annual report.-
 1
1 -
2
-
3
-
4
-
5
-
6
-
7
-
8
-
9
-
10
-
11
-
12
-
13
-
14
-
15
-
16
-
17
-
18
-
19
-
20
-
21
-
22
-
23
-
24
-
25
-
26
-
27
-
28
-
29
-
30
-
31
-
32
-
33
-
34
-
35
-
36
-
37
-
38
-
39
-
40
-
41
-
42
-
43
-
44
-
45
-
46
-
47
-
48
-
49
-
50
-
51
-
52
-
53
-
54
-
55
-
56
-
57
-
58
-
59
-
60
-
61
-
62
-
63
-
 64
64 -
 65
65 -
 66
66 -
 67
67 -
 68
68 -
 69
69 -
 70
70 -
 71
71 -
 72
72 -
 73
73 -
 74
74 -
 75
75 -
 76
76 -
 77
77 -
 78
78 -
 79
79 -
 80
80 -
 81
81 -
 82
82 -
 83
83 -
 84
84 -
85
-
86
-
87
-
88
-
89
-
90
-
91
-
92
-
93
-
94
-
95
-
96
-
97
-
98
-
99
-
100
 |
 |

SYSCO CORPORATION-Form10-K66
PARTII
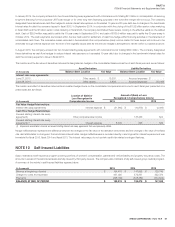
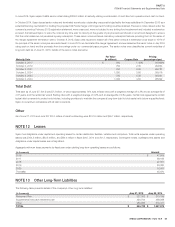
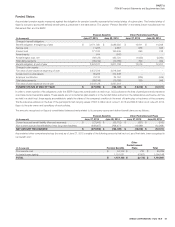
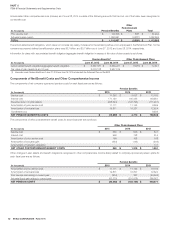
ITEM 8Financial Statements and Supplementary Data
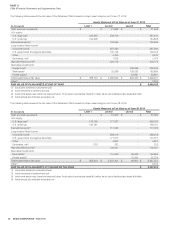
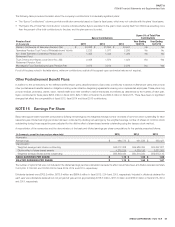
The following table presents the fair value of the Retirement Plan’s assets by major asset category as of June 27, 2015:
(Inthousands)
Assets Measured at Fair Value as of June 27, 2015
Level1 Level2 Level3 Total
Cash and cash equivalents $ - $ 21,968 $ - $ 21,968
U.S. equity:
U.S. large-cap(1) 233,525 333,709 - 567,234
U.S. small-cap 154,598 - - 154,598
International equity(2) - 732,595 - 732,595
Long duration xed income:
Corporate bonds - 567,280 - 567,280
U.S. government and agency securities - 190,125 - 190,125
Other - 4,343 - 4,343
Derivatives, net(3) - 1,078 - 1,078
High yield xed income(2) - 204,175 - 204,175
Alternative investments:
Hedge Fund(2) - - 335,265 335,265
Real estate(2) - 25,386 138,283 163,669
Private equity(2) - - 52,891 52,891
Total investments at fair value $ 388,123 $ 2,080,659 $ 526,439 $ 2,995,221
Other(4) 7,907
FAIR VALUE OF PLAN ASSETS AT END OF YEAR $ 3,003,128
(1) Include direct investments and investment funds.
(2) Include investments in investment funds only.
(3) Include credit default swaps, interest rate swaps and futures. The fair value of asset positions totaled $1.4 million; the fair value of liability positions totaled $0.3 million.
(4) Include primarily plan receivables and payables, net.
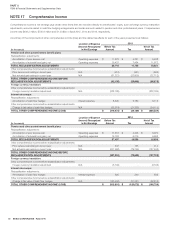
The following table presents the fair value of the Retirement Plan’s assets by major asset category as of June 28, 2014:
(Inthousands)
Assets Measured at Fair Value as of June 28, 2014
Level1 Level2 Level3 Total
Cash and cash equivalents $ - $ 51,066 $ - $ 51,066
U.S. equity:
U.S. large-cap(1) 218,165 777,627 - 995,792
U.S. small-cap 135,781 - - 135,781
International equity(2) - 717,022 - 717,022
Long duration xed income:
Corporate bonds - 568,419 - 568,419
U.S. government and agency securities - 171,617 - 171,617
Other - 4,907 - 4,907
Derivatives, net(3) (127) 352 - 225
High yield xed income(2) - 102,041 - 102,041
Alternative investments:
Real estate(2) - 114,250 35,403 149,653
Private equity(2) - - 31,204 31,204
Total investments at fair value $ 353,819 $ 2,507,301 $ 66,607 $ 2,927,727
Other(4) 9,792
FAIR VALUE OF PLAN ASSETS AT THE END OF THE YEAR $ 2,937,519
(1) Include direct investments and investment funds.
(2) Include investments in investment funds only.
(3) Include credit default swaps, interest rate swaps and futures. The fair value of asset positions totaled $0.8 million; the fair value of liability positions totaled $0.6 million.
(4) Include primarily plan receivables and payables, net.