Sysco 2015 Annual Report Download - page 35
Download and view the complete annual report
Please find page 35 of the 2015 Sysco annual report below. You can navigate through the pages in the report by either clicking on the pages listed below, or by using the keyword search tool below to find specific information within the annual report.-
 1
1 -
2
-
3
-
4
-
5
-
6
-
7
-
8
-
9
-
10
-
11
-
12
-
13
-
14
-
15
-
16
-
17
-
18
-
19
-
20
-
21
-
22
-
23
-
24
-
 25
25 -
 26
26 -
 27
27 -
 28
28 -
 29
29 -
 30
30 -
 31
31 -
 32
32 -
 33
33 -
 34
34 -
 35
35 -
 36
36 -
 37
37 -
 38
38 -
 39
39 -
 40
40 -
 41
41 -
 42
42 -
 43
43 -
 44
44 -
 45
45 -
46
-
47
-
48
-
49
-
50
-
51
-
52
-
53
-
54
-
55
-
56
-
57
-
58
-
59
-
60
-
61
-
62
-
63
-
64
-
65
-
66
-
67
-
68
-
69
-
70
-
71
-
72
-
73
-
74
-
75
-
76
-
77
-
78
-
79
-
80
-
81
-
82
-
83
-
84
-
85
-
86
-
87
-
88
-
89
-
90
-
91
-
92
-
93
-
94
-
95
-
96
-
97
-
98
-
99
-
100
 |
 |

SYSCO CORPORATION-Form10-K 27
PARTII
ITEM7Management’s Discussion and Analysis ofFinancial Condition and Results of Operations
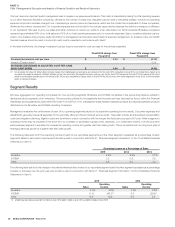
The following table sets forth sales and operating income of each of our reportable segments, the other segment, and intersegment sales, expressed as a
percentage of aggregate segment sales, including intersegment sales, and operating income, respectively. For purposes of this statistical table, operating
income of our segments excludes corporate expenses and adjustments of $1.5 billion in scal 2015, $1.0 billion in scal 2014 and $894.3 million in
scal 2013 that are not charged to our segments. This information should be read in conjunction with Note 21, “Business Segment Information” to the
Consolidated Financial Statements in Item 8:
2015 2014 2013
Sales
Segment
Operating
Income Sales
Segment
Operating
Income Sales
Segment
Operating
Income
Broadline 79.4% 94.3% 79.1% 93.1% 79.4% 92.5%
SYGMA 12.5 0.7 13.3 1.5 13.0 2.0
Other 10.8 5.0 10.1 5.4 9.9 5.5
Intersegment sales (2.7) - (2.5) - (2.3) -
TOTAL 100.0% 100.0% 100.0% 100.0% 100.0% 100.0%
Broadline Segment
The Broadline reportable segment is an aggregation of the company’s U.S. and International Broadline segments located in Bahamas, Canada, Costa
Rica and Ireland. Broadline operating companies distribute a full line of food products and a wide variety of non-food products to both traditional and chain
restaurant customers, hospitals, schools, hotels, industrial caterers and other venues where foodservice products are served. Broadline operations have
signi cantly higher operating margins than the rest of Sysco’s operations. In scal 2015, the Broadline operating results represented approximately 79.4%
of Sysco’s overall sales and 94.3% of the aggregate operating income of Sysco’s segments, which excludes corporate expenses.
There are several factors that contribute to these higher operating results as compared to the SYGMA and Other operating segments. We have invested
substantial amounts in assets, operating methods, technology and management expertise in this segment. The breadth of its sales force, geographic reach
of its distribution area and its purchasing power allow us to bene t from this segment’s earnings.
Sales
Sales for scal 2015 were 5.0% higher than scal 2014. Sales for scal 2015 increased as a result of product cost in ation and the resulting increase in
selling prices, case volume growth, and sales from acquisitions that occurred within the last 12 months. Our case volume growth in scal 2015 with our
locally-managed customers was strong and corporate-managed customer volumes increased as well. Sales from acquisitions within the last 12 months
favorably impacted sales by 0.5% in scal 2015. Changes in product costs, an internal measure of in ation or de ation, were estimated as in ation of
3.8% during scal 2015, driven mainly by in ation in the meat, seafood and dairy categories. The exchange rates used to translate our foreign sales into
U.S.dollars negatively impacted sales by 1.3% in scal 2015.
Sales for scal 2014 were 4.3% higher than scal 2013. Sales for scal 2014 increased as a result of sales from acquisitions that occurred within the last
12 months, case volume growth and product cost in ation and the resulting increase in selling prices. Our sales growth in scal 2014 was greater with
our corporate-managed customers as compared to sales growth with our locally-managed customers. The disparity in the growth rate between these
customer types moderated in the last half of scal 2014 with locally-managed sales growth trending at similar rates as corporate-managed customers. Sales
from acquisitions within the last 12 months favorably impacted sales by 1.7% in scal 2014. Changes in product costs, an internal measure of in ation or
de ation, were estimated as in ation of 2.0% during scal 2014, driven mainly by in ation in the meat, seafood and dairy categories. The exchange rates
used to translate our foreign sales into U.S. dollars negatively impacted sales by 0.8% in scal 2014.
Operating Income
Fiscal 2015 vs. Fiscal 2014
Operating income increased by 5.8% in scal 2015 over scal 2014. We experienced growth in our gross pro ts due to increased sales volumes, stronger
relative mix of sales for our locally-managed customers and bene ts from our category management initiative. Operating expenses increased from greater
case volumes, higher incentive accruals, higher pay for our sales organization as a result of higher gross pro t, investment in administrative support
capabilities and acquired operations.
Gross pro ts increased in scal 2015 as compared to scal 2014 and gross margins were steady. Increased competition resulting from a slow-growth
market and volatile in ation has pressured our gross margins; however, sales and mix, as well as our category management initiative, have helped us
stabilize our gross margin performance. Our in ation rates were higher in the rst half of scal 2015, reaching levels of 6% at the mid-point of the scalyear
and dropping to minimal amounts by the end of the scal year. Fiscal 2015 in ation was seen primarily in the meat, dairy and poultry categories.