Sysco 2015 Annual Report Download - page 5
Download and view the complete annual report
Please find page 5 of the 2015 Sysco annual report below. You can navigate through the pages in the report by either clicking on the pages listed below, or by using the keyword search tool below to find specific information within the annual report.-
 1
1 -
 2
2 -
 3
3 -
 4
4 -
 5
5 -
 6
6 -
 7
7 -
 8
8 -
 9
9 -
 10
10 -
 11
11 -
 12
12 -
 13
13 -
 14
14 -
 15
15 -
 16
16 -
17
-
18
-
19
-
20
-
21
-
22
-
23
-
24
-
25
-
26
-
27
-
28
-
29
-
30
-
31
-
32
-
33
-
34
-
35
-
36
-
37
-
38
-
39
-
40
-
41
-
42
-
43
-
44
-
45
-
46
-
47
-
48
-
49
-
50
-
51
-
52
-
53
-
54
-
55
-
56
-
57
-
58
-
59
-
60
-
61
-
62
-
63
-
64
-
65
-
66
-
67
-
68
-
69
-
70
-
71
-
72
-
73
-
74
-
75
-
76
-
77
-
78
-
79
-
80
-
81
-
82
-
83
-
84
-
85
-
86
-
87
-
88
-
89
-
90
-
91
-
92
-
93
-
94
-
95
-
96
-
97
-
98
-
99
-
100
 |
 |
We believe we can build on our recent
success in stabilizing gross margins
through enhanced product innovation,
growing our Sysco-brand sales and improv-
ing our pricing analytics and support. In
addition, we see significant potential to
improve our productivity and reduce costs
throughout our supply chain organization
and in the administrative areas of our
business. We will also continue to invest
in our business and improve our return on
invested capital over the next three years.
In closing, we are encouraged with our
recent momentum of demonstrable improve-
ment in our business performance. This
reflects that many of our foundational
strategies and plans are taking hold. In
turn, we thank you for your continued sup-
port for and confidence in Sysco, and we
look forward to a successful Fiscal 2016
and beyond.
Jackie Ward
Chairman of the Board
Bill DeLaney
President and Chief Executive Officer
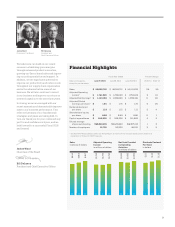
Financial Highlights
Fiscal Year Ended Percent Change
ooooooooooooooooooooooooooooooooooooooooooooooooooooooooooooooooooooooooooooooooooooooooooooooooooooooooooooooooooooooo ooooooooooooooooooooooooooooooo
Dollars in thousands, June 27, 2015 June 28, 2014 June 29, 2013 2015–14 2014–13
except for per share data
ooooooooooooooooooooooooooooooooooooooooooooooooooooooooooooooooooooooooooooooooooooooooooooooooooooooooooooooooooooooo ooooooooooooooooooooooooooooooo
S al e s $ 48,680,752 $ 46,516,712 $ 44,411,233 5% 5%
Adjusted Operating
income* $ 1,791,830 $ 1,733,630 $ 1,753,193 3 (1)
Adjusted Net Earnings* $ 1,100,166 $ 1,033,836 $ 1,055,319 6 (2)
Adjusted Diluted
earnings per share* $ 1.84 $ 1.75 $ 1.78 5 (2)
Dividends declared
per share $ 1.19 $ 1.15 $ 1.11 3 4
Shareholders’ equity
per share $ 8.96 $ 8.99 $ 8.86 0 1
Capital expenditures $ 542,830 $ 523,206 $ 511,862 4 2
Diluted average
shares outstanding 596,849,034 590,216,220 592,675,110 1 0
Number of employees 51,700 50,300 48,100 3 5
ooooooooooooooooooooooooooooooooooooooooooooooooooooooooooooooooooooooooooooooooooooooooooooooooooooooooooooooooooooooo ooooooooooooooooooooooooooooooo
* See Non-GAAP Reconciliations within our Annual Report on Form 10-K for the year ended June 27, 2015 for an
explanation of these non-GAAP measures.
Jackie Ward
Chairman of the Board
Bill DeLaney
President and
Chief Executive Officer
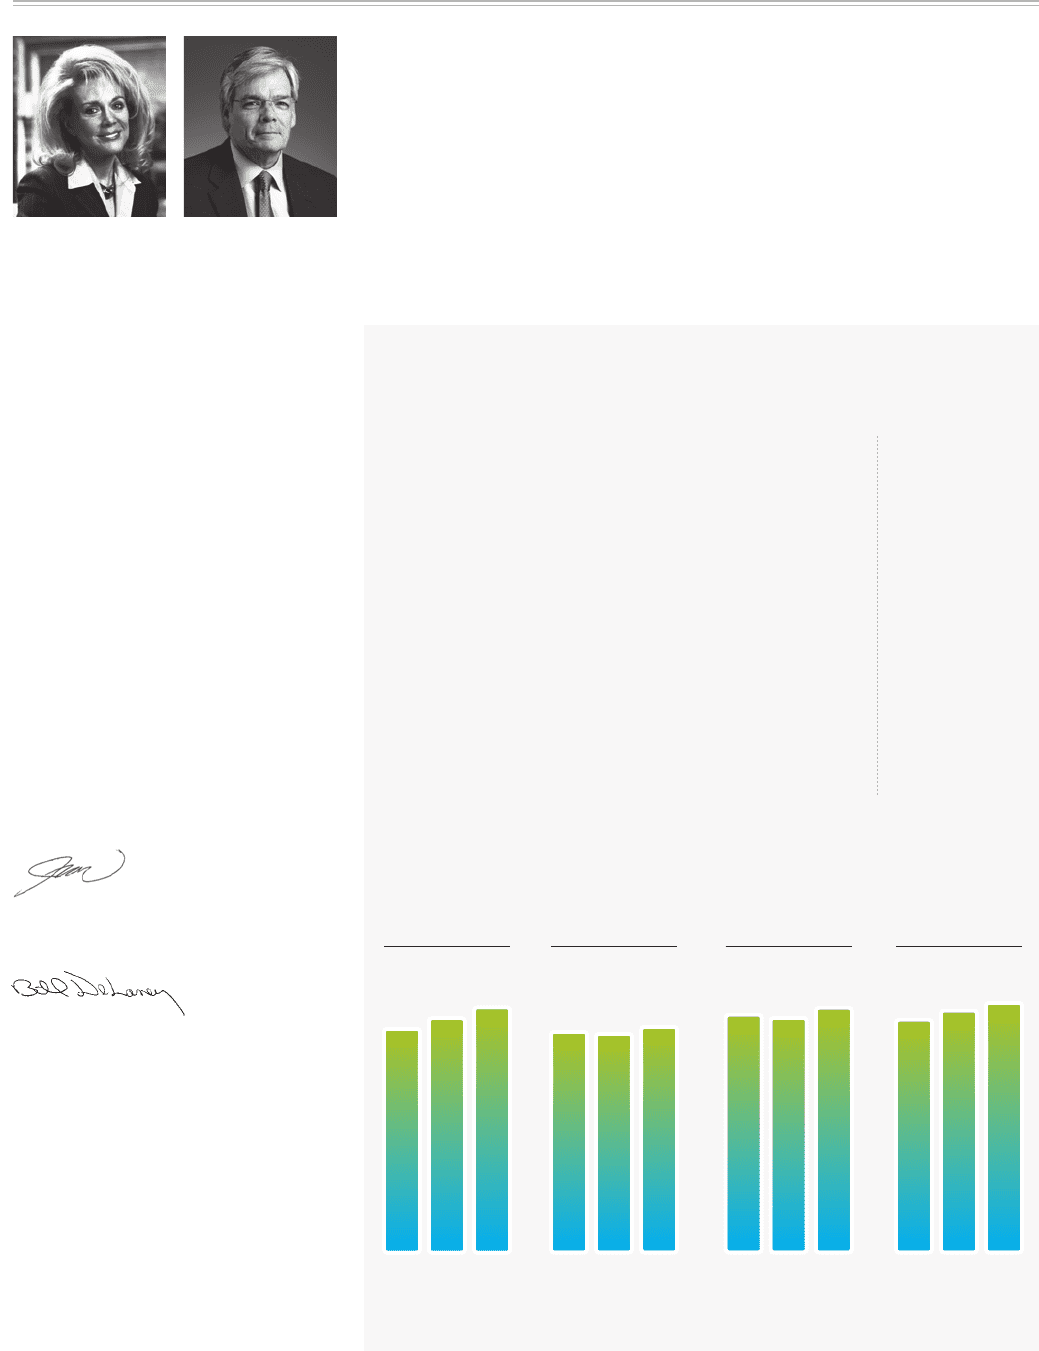
Sales
in billions of dollars
$44.4
$46.5
$48.7
13 14 15
Adjusted Operating
Income
in millions of dollars
$1,753
$1,734
$1,792
13 14 15
Dividends Declared
Per Share
in dollars
$1.11
$1.15
$1.19
13 14 15
Net Cash Provided
by Operating
Activities
in millions of dollars
$1,512
$1,493
$1,555
13 14 15
3