Sysco 2015 Annual Report Download - page 39
Download and view the complete annual report
Please find page 39 of the 2015 Sysco annual report below. You can navigate through the pages in the report by either clicking on the pages listed below, or by using the keyword search tool below to find specific information within the annual report.-
 1
1 -
2
-
3
-
4
-
5
-
6
-
7
-
8
-
9
-
10
-
11
-
12
-
13
-
14
-
15
-
16
-
17
-
18
-
19
-
20
-
21
-
22
-
23
-
24
-
25
-
26
-
27
-
28
-
 29
29 -
 30
30 -
 31
31 -
 32
32 -
 33
33 -
 34
34 -
 35
35 -
 36
36 -
 37
37 -
 38
38 -
 39
39 -
 40
40 -
 41
41 -
 42
42 -
 43
43 -
 44
44 -
 45
45 -
 46
46 -
 47
47 -
 48
48 -
 49
49 -
50
-
51
-
52
-
53
-
54
-
55
-
56
-
57
-
58
-
59
-
60
-
61
-
62
-
63
-
64
-
65
-
66
-
67
-
68
-
69
-
70
-
71
-
72
-
73
-
74
-
75
-
76
-
77
-
78
-
79
-
80
-
81
-
82
-
83
-
84
-
85
-
86
-
87
-
88
-
89
-
90
-
91
-
92
-
93
-
94
-
95
-
96
-
97
-
98
-
99
-
100
 |
 |
SYSCO CORPORATION-Form10-K 31
PARTII
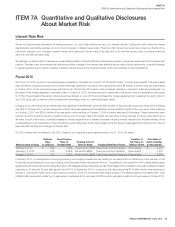
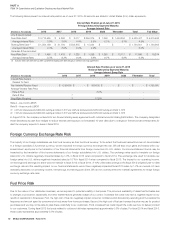
ITEM7Management’s Discussion and Analysis ofFinancial Condition and Results of Operations
Fiscal 2014 vs. Fiscal 2013
We generated $1.49 billion in cash ow from operations in scal 2014, as compared to $1.51 billion in scal 2013. The decrease of $18.8 million or 1.2%,
was largely attributable to a negative comparison on pension expense and contributions, reduced net earnings, a negative comparison on multiemployer
pension withdrawal provisions and payments and an unfavorable comparison on prepaid expenses. Partially offsetting these unfavorable comparisons
was a favorable comparison on working capital, several signi cant accruals in scal 2014 and an increase in non-cash depreciation and amortization.
Included in the change in other long-term liabilities was a negative comparison on pension expense and contributions, which contributed $65 million to
the unfavorable comparison on cash ow from operations for scal 2014 to scal 2013. Pension expense was $4.8 million and pension contributions were
$24.8 million in scal 2014, which resulted in a decrease to other long-term liabilities. Pension expense was $138.3 million and pension contributions were
$93.6 million in scal 2013, which resulted in an increase to other long-term liabilities.
Included in the change in accrued expenses was a negative comparison of $49.4 million on multiemployer withdrawal provisions and payments. Fiscal
2014 included a provision for multiemployer pension withdrawal of $1.5 million and payments of $40.8 million, which resulted in a decrease to accrued
expenses. Fiscal 2013 included a provision for multiemployer pension withdrawal of $41.9 million and payments of $31.8 million, which resulted in an
increase to accrued expenses. Partially offsetting the unfavorable impact of the multiemployer accrual comparison were several signi cant accruals unique
to scal 2014, which contributed $48.5 million to cash ow from operations for scal 2014 to scal 2013.
Changes in working capital, speci cally accounts receivable, inventory and accounts payable, had a favorable comparison of $129.7 million on the comparison
of cash ow from operations for scal 2014 to scal 2013. There was a favorable comparison on accounts payable, which was partially offset by unfavorable
comparisons on accounts receivable and inventory. Accounts receivable increased in both periods as a result of increases in sales. Our sales growth in
scal2014 was greater with our corporate-managed customers and payment terms for these types of customers are traditionally longer than average. This
mix of longer-term receivables contributed to the unfavorable comparison on cash ow from scal 2014 to scal 2013. Inventory increased in both periods
as a result of increases in sales. However, inventory turnover improved in scal 2014, as compared to a deterioration of inventory turnover in scal 2013,
due to working capital improvements in inventory. Fiscal 2014 also included an increase in inventory in transit, which offset the favorable comparison due
to working capital improvements, resulting in an overall unfavorable comparison on cash ow from scal 2014 to scal 2013. Accounts payable increased
in both periods as a result of increases in sales. The year-over-year impact of the change in accounts payable is favorable to cash ow from operations
due to working capital improvements in accounts payable as well as an increase in scal 2014 in accounts payable related to inventory in transit.
Investing Activities
Fiscal 2015 capital expenditures included:
• eet replacements;
•investments in technology.
•replacement or signi cant expansion of facilities in Arizona, California, Iowa and Virginia; and
•construction of fold-out facilities in Ireland.
Fiscal 2014 capital expenditures included:
• eet replacements;
•construction of fold-out facilities in Ontario, Canada and Ireland;
•replacement or signi cant expansion of facilities in Arizona, California, Pennsylvania and Virginia; and
•investments in technology.
Fiscal 2013 capital expenditures included:
• eet replacements;
•construction of a fold-out facility in southern California;
•replacement or signi cant expansion of facilities in Georgia; British Columbia, Canada; Massachusetts and South Carolina; and
•investments in technology.
The level of capital expenditures in scal 2015 was mostly consistent with scal 2014, representing a small increase of $19.6 million. Capital expenditures
in scal 2014 increased by $11.3 million from scal 2013. Capital expenditures in scal 2014 and 2013 for our Business Transformation Project were
$33.4million and $20.0 million, respectively.