Sysco 2015 Annual Report Download - page 40
Download and view the complete annual report
Please find page 40 of the 2015 Sysco annual report below. You can navigate through the pages in the report by either clicking on the pages listed below, or by using the keyword search tool below to find specific information within the annual report.-
 1
1 -
2
-
3
-
4
-
5
-
6
-
7
-
8
-
9
-
10
-
11
-
12
-
13
-
14
-
15
-
16
-
17
-
18
-
19
-
20
-
21
-
22
-
23
-
24
-
25
-
26
-
27
-
28
-
29
-
 30
30 -
 31
31 -
 32
32 -
 33
33 -
 34
34 -
 35
35 -
 36
36 -
 37
37 -
 38
38 -
 39
39 -
 40
40 -
 41
41 -
 42
42 -
 43
43 -
 44
44 -
 45
45 -
 46
46 -
 47
47 -
 48
48 -
 49
49 -
 50
50 -
51
-
52
-
53
-
54
-
55
-
56
-
57
-
58
-
59
-
60
-
61
-
62
-
63
-
64
-
65
-
66
-
67
-
68
-
69
-
70
-
71
-
72
-
73
-
74
-
75
-
76
-
77
-
78
-
79
-
80
-
81
-
82
-
83
-
84
-
85
-
86
-
87
-
88
-
89
-
90
-
91
-
92
-
93
-
94
-
95
-
96
-
97
-
98
-
99
-
100
 |
 |
SYSCO CORPORATION-Form10-K32
PARTII
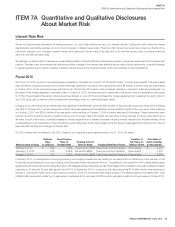
ITEM7Management’s Discussion and Analysis ofFinancial Condition and Results of Operations
We estimate our capital expenditures, net of proceeds from sales of assets, in scal 2016 should be in the range of $550 million to $600 million. Fiscal
2016 expenditures will include facility, eet and other equipment replacements and expansions; new facility construction, including fold-out facilities; and
investments in technology.
During scal 2015, in the aggregate, the company paid cash of $115.9 million for operations acquired during scal 2015 and for contingent consideration
related to operations acquired in previous scal years. During scal 2015, we acquired for cash a broadline company in Ontario, Canada; a joint venture
interest in a foodservice distribution company in Mexico; a joint venture interest in a foodservice distribution company in Costa Rica and a specialty seafood
company in New Jersey.
During scal 2014, in the aggregate, the company paid cash of $79.3 million for operations acquired during scal 2014 and for contingent consideration
related to operations acquired in previous scal years. During scal 2014, we acquired for cash a specialty meat company in Maryland and broadline
operations in Missouri, Ohio and Philadelphia.
During scal 2013, in the aggregate, the company paid cash of $397.4 million for operations acquired during scal 2013 and for contingent consideration
related to operations acquired in previous scal years. During scal 2013, we acquired for cash broadline operations in Bahamas, California, Ohio, Quebec,
Canada, Northern Ireland; specialty seafood companies in Ontario, Canada, Florida and Houston; specialty produce in Ireland and our Sysco Ventures
startup in California.
Free Cash Flow
Free cash ow represents net cash provided from operating activities less purchases of plant and equipment plus proceeds from sales of plant and
equipment. Sysco considers free cash ow to be a non-GAAP liquidity measure that provides useful information to management and investors about
the amount of cash generated by the business after the purchases and sales of buildings, eet, equipment and technology, which may potentially be
used to pay for, among other things, strategic uses of cash including dividend payments, share repurchases and acquisitions. However, free cash
ow may not be available for discretionary expenditures, as it may be necessary that we use it to make mandatory debt service or other payments.
As a result of increased cash provided by operating activities, partially offset by increased capital spending and decreased proceeds from sales of
plant and equipment, free cash ow for scal 2015 increased 4.2%, or $41.7 million, to $1.0 billion as compared to scal 2014. Increased cash
provided by operating activities, partially offset by increased capital spending, resulted in free cash ow for scal 2014 decreasing 2.0%, or $19.9 million,
to $995.4 million as compared to scal 2013.
Free cash ow should not be used as a substitute in assessing the company’s liquidity for the periods presented. An analysis of any non-GAAP nancial
measure should be used in conjunction with results presented in accordance with GAAP. In the table that follows, free cash ow for each period presented
is reconciled to net cash provided by operating activities.
(In thousands)
2015 2014 Change in Dollars % Change
Net cash provided by operating activities (GAAP) $ 1,555,484 $ 1,492,815 $ 62,669 4.2
Additions to plant and equipment (542,830) (523,206) (19,624) 3.8
Proceeds from sales of plant and equipment 24,472 25,790 (1,318) (5.1)
FREE CASH FLOW (NON-GAAP) $ 1,037,126 $ 995,399 $ 41,727 4.2
(In thousands) 2014
2013 Change in Dollars % Change
Net cash provided by operating activities (GAAP) $ 1,492,815 $ 1,511,594 $ (18,779)(1.2)
Additions to plant and equipment (523,206) (511,862) (11,344) 2.2
Proceeds from sales of plant and equipment 25,790 15,527 10,263 66.1
FREE CASH FLOW (NON-GAAP) $ 995,399 $ 1,015,259 $ (19,860) (2.0)
Financing Activities
Equity Transactions
Proceeds from exercises of share-based compensation awards were $240.2 million in scal 2015, $255.6 million in scal 2014 and $628.7 million in
scal 2013. The level of proceeds in each year is directly related to the number of options exercised in each year. The level of option exercises, and thus
proceeds, will vary from period to period and is largely dependent on movements in our stock price.