Sysco 2015 Annual Report Download - page 27
Download and view the complete annual report
Please find page 27 of the 2015 Sysco annual report below. You can navigate through the pages in the report by either clicking on the pages listed below, or by using the keyword search tool below to find specific information within the annual report.-
 1
1 -
2
-
3
-
4
-
5
-
6
-
7
-
8
-
9
-
10
-
11
-
12
-
13
-
14
-
15
-
16
-
 17
17 -
 18
18 -
 19
19 -
 20
20 -
 21
21 -
 22
22 -
 23
23 -
 24
24 -
 25
25 -
 26
26 -
 27
27 -
 28
28 -
 29
29 -
 30
30 -
 31
31 -
 32
32 -
 33
33 -
 34
34 -
 35
35 -
 36
36 -
 37
37 -
38
-
39
-
40
-
41
-
42
-
43
-
44
-
45
-
46
-
47
-
48
-
49
-
50
-
51
-
52
-
53
-
54
-
55
-
56
-
57
-
58
-
59
-
60
-
61
-
62
-
63
-
64
-
65
-
66
-
67
-
68
-
69
-
70
-
71
-
72
-
73
-
74
-
75
-
76
-
77
-
78
-
79
-
80
-
81
-
82
-
83
-
84
-
85
-
86
-
87
-
88
-
89
-
90
-
91
-
92
-
93
-
94
-
95
-
96
-
97
-
98
-
99
-
100
 |
 |

SYSCO CORPORATION-Form10-K 19
PARTII
ITEM7Management’s Discussion and Analysis ofFinancial Condition and Results of Operations
•
Develop and effectively integrate a comprehensive, enterprise-wide talent management process: Our ability to drive results and grow our business is
directly linked to having the best talent in the industry. We are committed to the continued enhancement of our talent management programs in terms
of how we recruit, select, train and develop our associates throughout Sysco, as well as succession planning. Our ultimate objective is to provide our
associates with outstanding opportunities for professional growth and career development.
In scal 2016, to further our strategy, we see opportunities to further accelerate case growth, especially with our locally-managed sales customers through
improved product and service differentiation combined with enhanced sales and technology capabilities. We will continue to build on our success in stabilizing
gross margin through enhanced product innovation, growing privately-branded product sales and improving pricing analytics and support. There continues
to be opportunity to improve our productivity and reduce overhead costs in our supply chain organization and administrative areas of our business. We
will continue to invest in our business to fully realize the bene ts and improve our return on invested capital.
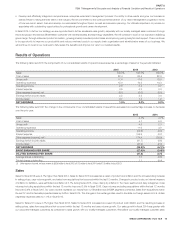
Results of Operations
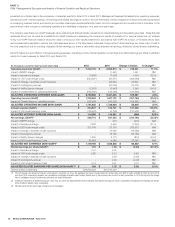
The following table sets forth the components of our consolidated results of operations expressed as a percentage of sales for the periods indicated:
2015 2014 2013
Sales 100.0% 100.0% 100.0%
Cost of sales 82.4 82.4 82.0
Gross pro t 17.6 17.6 18.0
Operating expenses 15.0 14.2 14.3
Operating income 2.6 3.4 3.7
Interest expense 0.5 0.2 0.3
Other expense (income), net (0.1) (0.0) (0.0)
Earnings before income taxes 2.2 3.2 3.4
Income taxes 0.7 1.2 1.2
NET EARNINGS 1.5% 2.0% 2.2%
The following table sets forth the change in the components of our consolidated results of operations expressed as a percentage increase or decrease
over the prior year:
2015 2014
Sales 4.7% 4.7%
Cost of sales 4.7 5.3
Gross pro t 4.5 2.3
Operating expenses 11.0 4.0
Operating income (22.5) (4.3)
Interest expense 105.9 (3.7)
Other expense (income), net(1) 174.4 (29.9)
Earnings before income taxes (31.7) (4.6)
Income taxes (40.9) (2.0)
NET EARNINGS (26.3)% (6.1)%
BASIC EARNINGS PER SHARE (27.0)% (5.4)%
DILUTED EARNINGS PER SHARE (27.2) (5.4)
Average shares outstanding 1.0 (0.6)
Diluted shares outstanding 1.1 (0.4)
(1) Other expense (income), net was income of $33.6 million in fiscal 2015, $12.2 million in fiscal 2014 and $17.5 million in fiscal 2013.
Sales
Sales for scal 2015 were 4.7% higher than scal 2014. Sales for scal 2015 increased as a result of product cost in ation and the corresponding increase
in selling prices, case volume growth, and sales from acquisitions that occurred within the last 12 months. Changes in product costs, an internal measure
of in ation or de ation, were estimated as in ation of 3.7% during scal 2015, driven mainly by in ation in the meat, seafood and dairy categories. Case
volumes including acquisitions within the last 12 months improved 2.6% in scal 2015. Case volumes excluding acquisitions within the last 12 months
improved 2.4% in scal 2015. Our case volumes represent our results from our Broadline and SYGMA segments combined. Sales from acquisitions within
the last 12 months favorably impacted sales by 0.6% in scal 2015. The changes in the exchange rates used to translate our foreign sales into U.S. dollars
negatively impacted sales by 1.0% in scal 2015.
Sales for scal 2014 were 4.7% higher than scal 2013. Sales for scal 2014 increased as a result of product cost in ation and the resulting increase in
selling prices, sales from acquisitions that occurred within the last 12 months and case volume growth. Our sales growth in scal 2014 was greater with
our corporate-managed customers as compared to sales growth with our locally-managed customers. We believe our locally-managed customer sales