Sysco 2015 Annual Report Download - page 33
Download and view the complete annual report
Please find page 33 of the 2015 Sysco annual report below. You can navigate through the pages in the report by either clicking on the pages listed below, or by using the keyword search tool below to find specific information within the annual report.-
 1
1 -
2
-
3
-
4
-
5
-
6
-
7
-
8
-
9
-
10
-
11
-
12
-
13
-
14
-
15
-
16
-
17
-
18
-
19
-
20
-
21
-
22
-
 23
23 -
 24
24 -
 25
25 -
 26
26 -
 27
27 -
 28
28 -
 29
29 -
 30
30 -
 31
31 -
 32
32 -
 33
33 -
 34
34 -
 35
35 -
 36
36 -
 37
37 -
 38
38 -
 39
39 -
 40
40 -
 41
41 -
 42
42 -
 43
43 -
44
-
45
-
46
-
47
-
48
-
49
-
50
-
51
-
52
-
53
-
54
-
55
-
56
-
57
-
58
-
59
-
60
-
61
-
62
-
63
-
64
-
65
-
66
-
67
-
68
-
69
-
70
-
71
-
72
-
73
-
74
-
75
-
76
-
77
-
78
-
79
-
80
-
81
-
82
-
83
-
84
-
85
-
86
-
87
-
88
-
89
-
90
-
91
-
92
-
93
-
94
-
95
-
96
-
97
-
98
-
99
-
100
 |
 |

SYSCO CORPORATION-Form10-K 25
PARTII
ITEM7Management’s Discussion and Analysis ofFinancial Condition and Results of Operations
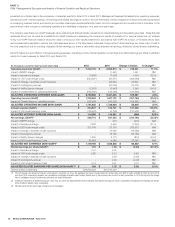
Set forth below is a reconciliation of actual operating expenses, operating income, net earnings and diluted earnings per share to adjusted results for these
measures for scal 2014 and scal 2013:
(In thousands, except for share and per share data)
2014 2013 Change in Dollars % Change(3)
Operating expenses (GAAP) $ 6,593,913 $ 6,338,129 $ 255,784 4.0%
Impact of restructuring executive retirement plans (3,329) (20,990) 17,661 (84.1)
Impact of MEPP charges (1,451) (41,876) 40,425 (96.5)
Impact of severance charges (7,202) (23,206) 16,004 (69.0)
Impact of US Foods merger costs (90,571) - (90,571) NM
Impact of FY13 acquisition-related charge - (5,998) 5,998 NM
Impact of change in estimate of self insurance (23,841) - (23,841) NM
Impact of contingency accrual (20,000) - (20,000) NM
Impact of facility closure charges (3,443) (2,645) (798) 30.2
ADJUSTED OPERATING EXPENSES (NON-GAAP) $6,444,076 $ 6,243,414 $ 200,662 3.2%
Operating Income (GAAP) $ 1,587,122 $ 1,658,478 $ (71,356) (4.3)%
Impact of restructuring executive retirement plans 3,329 20,990 (17,661) (84.1)
Impact of MEPP charges 1,451 41,876 (40,425) (96.5)
Impact of severance charges 7,202 23,206 (16,004) (69.0)
Impact of US Foods merger costs 90,571 - 90,571 NM
Impact of FY13 acquisition-related charge - 5,998 (5,998) NM
Impact of change in estimate of self insurance 23,841 - 23,841 NM
Impact of contingency accrual 20,000 - 20,000 NM
Impact of facility closure charges 3,443 2,645 798 30.2
ADJUSTED OPERATING INCOME (NON-GAAP) $ 1,736,959 $ 1,753,193 $ (16,234) (0.9)%
Interest Expense (GAAP) $ 123,741 $ 128,495 $ (4,754)(3.7)%
Impact of US Foods nancing costs (6,790) - (6,790) NM
ADJUSTED INTEREST EXPENSE (NON-GAAP) $ 116,951 $ 128,495 $ (11,544) (9.0)%
Net earnings (GAAP)(1) $ 931,533 $ 992,427 $ (60,894) (6.1)%
Impact of restructuring executive retirement plans 2,102 13,461 (11,359) (84.4)
Impact of MEPP charges 916 26,855 (25,939) (96.6)
Impact of severance charges 4,546 14,882 (10,336) (69.5)
Impact of US Foods merger costs 57,176 - 57,176 NM
Impact of FY13 acquisition-related charge - 5,998 (5,998) NM
Impact of change in estimate of self insurance 15,050 - 15,050 NM
Impact of contingency accrual 18,156 - 18,156 NM
Impact of facility closure charges 2,173 1,696 477 28.1
Impact of US Foods nancing costs 4,286 - 4,286 NM
ADJUSTED NET EARNINGS (NON-GAAP)(1) $ 1,035,938 $ 1,055,319 $ (19,381) (1.8)%
Diluted earnings per share (GAAP)(1) $ 1.58 $ 1.67 $ (0.09) (5.4)%
Impact of restructuring executive retirement plans - 0.02 (0.02) NM
Impact of MEPP charges - 0.05 (0.05) NM
Impact of severance charges 0.01 0.03 (0.02) (66.7)
Impact of US Foods merger costs 0.10 - 0.10 NM
Impact of FY13 acquisition-related charge - 0.01 (0.01) NM
Impact of change in estimate of self insurance 0.03 - 0.03 NM
Impact of contingency accrual 0.03 - 0.03 NM
Impact of US Foods nancing costs 0.01 - 0.01 NM
ADJUSTED DILUTED EARNINGS PER SHARE (NON-GAAP)(1)(2)
$ 1.76 $ 1.78 $ (0.02) (1.1)%
Diluted shares outstanding 590,216,220 592,675,110
(1) The net earnings and diluted earnings per share impacts are shown net of tax, except as noted below. The aggregate tax impact of adjustments for Certain Items was $67.2 million and
$37.8million for fiscal 2014 and fiscal 2013, respectively. The fiscal 2014 acquisition-related charge had no tax impact. Amounts are calculated by multiplying the operating income impact of
each item by the respective year’s effective tax rate with the exception of the impact of the charges from an estimate of a contingency accrual, which had an estimated non-deductible portion.
(2) Individual components of diluted earnings per share may not add to the total presented due to rounding. Total diluted earnings per share is calculated using adjusted net earnings for Certain
Items divided by diluted shares outstanding.
(3) NM represents that the percentage change was not meaningful.