Sysco 2015 Annual Report Download - page 32
Download and view the complete annual report
Please find page 32 of the 2015 Sysco annual report below. You can navigate through the pages in the report by either clicking on the pages listed below, or by using the keyword search tool below to find specific information within the annual report.-
 1
1 -
2
-
3
-
4
-
5
-
6
-
7
-
8
-
9
-
10
-
11
-
12
-
13
-
14
-
15
-
16
-
17
-
18
-
19
-
20
-
21
-
 22
22 -
 23
23 -
 24
24 -
 25
25 -
 26
26 -
 27
27 -
 28
28 -
 29
29 -
 30
30 -
 31
31 -
 32
32 -
 33
33 -
 34
34 -
 35
35 -
 36
36 -
 37
37 -
 38
38 -
 39
39 -
 40
40 -
 41
41 -
 42
42 -
43
-
44
-
45
-
46
-
47
-
48
-
49
-
50
-
51
-
52
-
53
-
54
-
55
-
56
-
57
-
58
-
59
-
60
-
61
-
62
-
63
-
64
-
65
-
66
-
67
-
68
-
69
-
70
-
71
-
72
-
73
-
74
-
75
-
76
-
77
-
78
-
79
-
80
-
81
-
82
-
83
-
84
-
85
-
86
-
87
-
88
-
89
-
90
-
91
-
92
-
93
-
94
-
95
-
96
-
97
-
98
-
99
-
100
 |
 |
SYSCO CORPORATION-Form10-K24
PARTII
ITEM7Management’s Discussion and Analysis ofFinancial Condition and Results of Operations
presented as a Certain Item in the comparison of adjusted results for scal 2014 to scal 2013. Management believes that adjusting its operating expenses,
operating income, interest expense, net earnings and diluted earnings per share to remove the impact of these charges provides an important perspective
of underlying business trends and results and provides meaningful supplemental information to both management and investors that is indicative of the
performance of the company’s underlying operations and facilitates comparison on a year-over-year basis.
The company uses these non-GAAP measures when evaluating its nancial results, as well as for internal planning and forecasting purposes. These nancial
measures should not be used as a substitute for GAAP measures in assessing the company’s results of operations for periods presented. An analysis
of any non-GAAP nancial measure should be used in conjunction with results presented in accordance with GAAP. As a result, in the table below, each
period presented is adjusted to remove the costs described above. In the table below, individual components of diluted earnings per share may not add to
the total presented due to rounding. Adjusted diluted earnings per share is calculated using adjusted net earnings divided by diluted shares outstanding.
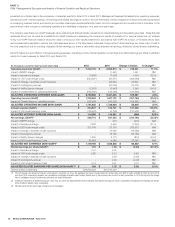
Set forth below is a reconciliation of actual operating expenses, operating income, interest expense, net earnings and diluted earnings per share to adjusted
results for these measures for scal 2015 and scal 2014:
(In thousands, except for share and per share data)
2015 2014 Change in Dollars % Change(3)
Operating expenses (GAAP) $ 7,322,154 $ 6,593,913 $ 728,241 11.0%
Impact of MEPP charge - (1,451) 1,451 NM
Impact of severance charges (5,598) (7,202) 1,604 (22.3)
Impact of US Foods merger costs (554,667) (90,571) (464,096) NM
Impact of change in estimate of self insurance - (23,841) 23,841 NM
Impact of contingency accrual - (20,000) 20,000 NM
Impact of facility closure charges (2,203) (3,443) 1,240 (36.0)
Impact of Certain Items on operating expenses (562,468) (146,508) (415,960) NM
ADJUSTED OPERATING EXPENSES (NON-GAAP) $ 6,759,686 $ 6,447,405 $ 312,281 4.8%
Operating Income (GAAP) $ 1,229,362 $ 1,587,122 $ (357,760) (22.5)%
Impact of Certain Items on operating income 562,468 146,508 415,960 NM
ADJUSTED OPERATING INCOME (NON-GAAP) $ 1,791,830 $ 1,733,630 $ 58,200 3.4%
Interest expense (GAAP) $ 254,807 $ 123,741 $ 131,066 105.9%
Impact of US Foods nancing costs (138,422) (6,790) (131,632) NM
ADJUSTED INTEREST EXPENSE (NON-GAAP) $ 116,385 $ 116,951 $ (566) (0.5)%
Net earnings (GAAP)(1) $ 686,773 $ 931,533 $ (244,760) (26.3)%
Impact of MEPP charge - 916 (916) NM
Impact of severance charge 3,302 4,546 (1,244) (27.4)
Impact of US Foods merger costs 327,149 57,176 269,973 NM
Impact of change in estimate of self insurance - 15,050 (15,050) NM
Impact of contingency accrual - 18,156 (18,156) NM
Impact of facility closure charges 1,299 2,173 (874) (40.2)
Impact of US Foods Financing Costs 81,643 4,286 77,357 NM
ADJUSTED NET EARNINGS (NON-GAAP)(1) $ 1,100,166 $ 1,033,836 $ 66,330 6.4%
Diluted earnings per share (GAAP)(1) $ 1.15 $ 1.58 $ (0.43) (27.2)%
Impact of severance charge 0.01 0.01 - -
Impact of US Foods merger costs 0.55 0.10 0.45 NM
Impact of change in estimate of self insurance - 0.03 (0.03) NM
Impact of contingency accrual - 0.03 (0.03) NM
Impact of US Foods Financing Costs 0.14 0.01 0.13 NM
ADJUSTED DILUTED EARNINGS PER SHARE (NON-GAAP)(1)(2) $ 1.84 $ 1.75 $ 0.09 5.1%
Diluted shares outstanding 596,849,034 590,216,220
(1) The net earnings and diluted earnings per share impacts are shown net of tax. The aggregate tax impact of adjustments for Certain Items was $287.5 million and $55.8 million for fiscal 2015
and fiscal 2014, respectively. Amounts are calculated by multiplying the pretax impact of each Certain Item by the statutory rates in effect for each jurisdiction. In FY14, the impact of the charge
from a contingency accrual contained an estimated non-deductible portion.
(2) Individual components of diluted earnings per share may not add to the total presented due to rounding. Total diluted earnings per share is calculated using adjusted net earnings for Certain
Items divided by diluted shares outstanding.
(3) NM represents that the percentage change was not meaningful.