Sysco 2015 Annual Report Download - page 91
Download and view the complete annual report
Please find page 91 of the 2015 Sysco annual report below. You can navigate through the pages in the report by either clicking on the pages listed below, or by using the keyword search tool below to find specific information within the annual report.-
 1
1 -
2
-
3
-
4
-
5
-
6
-
7
-
8
-
9
-
10
-
11
-
12
-
13
-
14
-
15
-
16
-
17
-
18
-
19
-
20
-
21
-
22
-
23
-
24
-
25
-
26
-
27
-
28
-
29
-
30
-
31
-
32
-
33
-
34
-
35
-
36
-
37
-
38
-
39
-
40
-
41
-
42
-
43
-
44
-
45
-
46
-
47
-
48
-
49
-
50
-
51
-
52
-
53
-
54
-
55
-
56
-
57
-
58
-
59
-
60
-
61
-
62
-
63
-
64
-
65
-
66
-
67
-
68
-
69
-
70
-
71
-
72
-
73
-
74
-
75
-
76
-
77
-
78
-
79
-
80
-
 81
81 -
 82
82 -
 83
83 -
 84
84 -
 85
85 -
 86
86 -
 87
87 -
 88
88 -
 89
89 -
 90
90 -
 91
91 -
 92
92 -
 93
93 -
 94
94 -
 95
95 -
 96
96 -
 97
97 -
 98
98 -
 99
99 -
 100
100
 |
 |
SYSCO CORPORATION-Form10-K 83
PARTII
ITEM 8Financial Statements and Supplementary Data
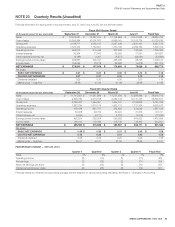
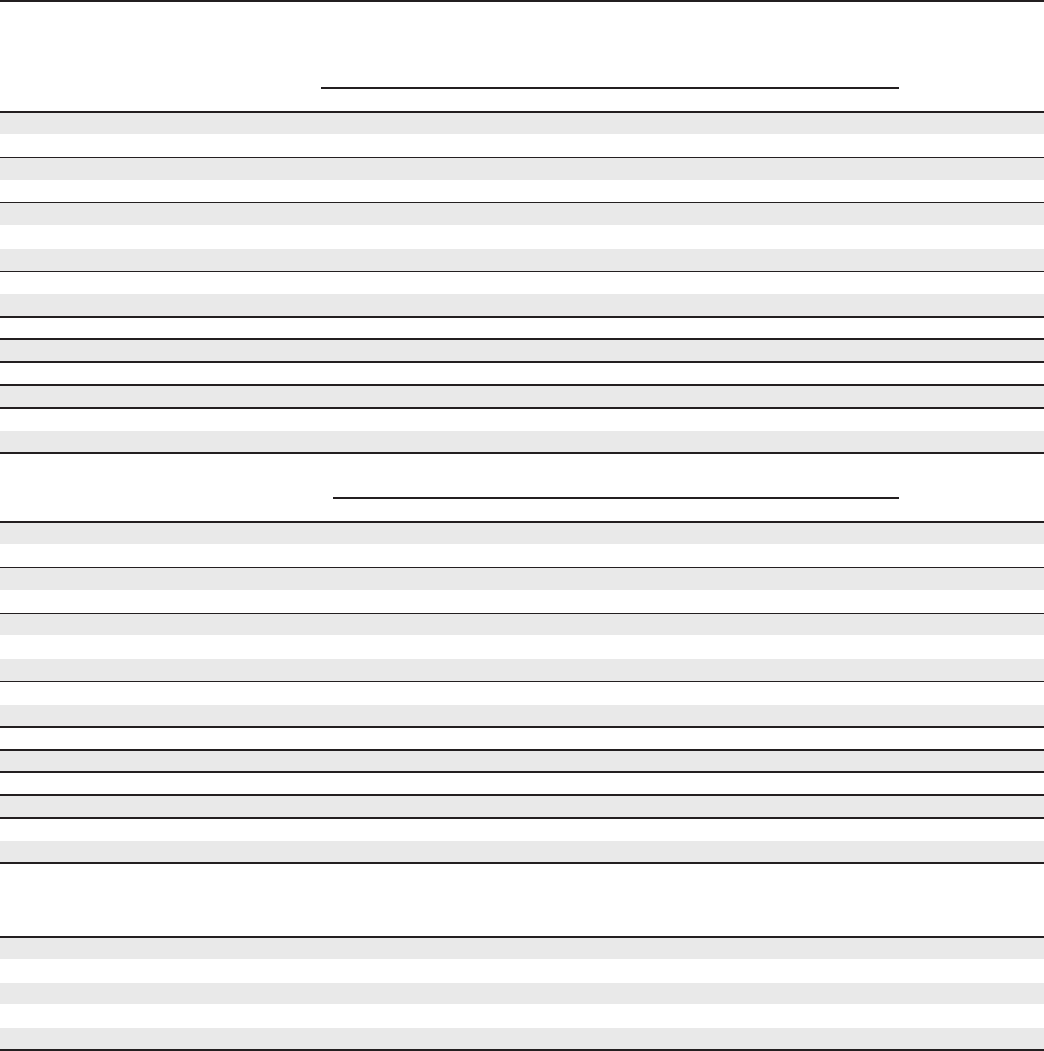
NOTE23 Quarterly Results (Unaudited)
Financial information for each quarter in the years ended June 27, 2015 and June 28, 2014 is set forth below:
(Inthousands except for per share data)
Fiscal 2015 Quarter Ended
Fiscal YearSeptember 27 December 27 March 28 June27
Sales $ 12,445,081 $ 12,087,074 $ 11,746,659 $ 12,401,938 $ 48,680,752
Cost of sales 10,256,364 10,001,937 9,689,161 10,181,774 40,129,236
Gross pro t 2,188,717 2,085,137 2,057,498 2,220,164 8,551,516
Operating expenses 1,723,104 1,769,691 1,730,190 2,099,169 7,322,154
Operating income 465,613 315,446 327,308 120,995 1,229,362
Interest expense 30,934 77,042 69,550 77,281 254,807
Other expense (income), net (2,188) 2,207 (8,577) (25,034) (33,592)
Earnings before income taxes 436,867 236,197 266,335 68,748 1,008,147
Income taxes 158,054 78,218 89,380 (4,278) 321,374
NET EARNINGS $ 278,813 $ 157,979 $ 176,955 $ 73,026 $ 686,773
Per share:
BASIC NET EARNINGS $ 0.47 $ 0.27 $ 0.30 $ 0.12 $ 1.16
DILUTED NET EARNINGS 0.47 0.27 0.30 0.12 1.15
Dividends declared 0.29 0.30 0.30 0.30 1.19
Market price — high/low 39-36 41-36 41-38 39-36 41-36
(Inthousands except for per share data)
Fiscal 2014 Quarter Ended
Fiscal YearSeptember 28 December 28 March 29 June28
Sales $ 11,714,267 $ 11,237,969 $ 11,277,484 $ 12,286,992 $ 46,516,712
Cost of sales 9,648,780 9,273,018 9,282,743 10,131,136 38,335,677
Gross pro t 2,065,487 1,964,951 1,994,741 2,155,856 8,181,035
Operating expenses 1,587,289 1,613,174 1,662,116 1,731,334 6,593,913
Operating income 478,198 351,777 332,625 424,522 1,587,122
Interest expense 30,528 29,784 32,224 31,205 123,741
Other (income), net (4,534) (4,211) 3,718 (7,216) (12,243)
Earnings before income taxes 452,204 326,204 296,683 400,533 1,475,624
Income taxes 166,614 115,369 115,746 146,362 544,091
NET EARNINGS $ 285,590 $ 210,835 $ 180,937 $ 254,171 $ 931,533
Per share:
BASIC NET EARNINGS $ 0.49 $ 0.36 $ 0.31 $ 0.43 $ 1.59
DILUTED NET EARNINGS 0.48 0.36 0.31 0.43 1.58
Dividends declared 0.28 0.29 0.29 0.29 1.15
Market price — high/low 36-31 43-31 37-34 38-35 43-31
PERCENTAGE CHANGE — 2015 VS. 2014:
Quarter 1 Quarter 2 Quarter 3 Quarter 4 Fiscal Year
Sales 6% 8% 4% 1% 5%
Operating income (3) (10) (2) (71) (23)
Net earnings (2) (25) (2) (71) (26)
Basic net earnings per share (4) (25) (3) (72) (27)
Diluted net earnings per share (2) (25) (3) (72) (27)
Financial results are impacted by accounting changes and the adoption of various accounting standards. See Note 2, “Changes in Accounting.”