Sysco 2015 Annual Report Download - page 25
Download and view the complete annual report
Please find page 25 of the 2015 Sysco annual report below. You can navigate through the pages in the report by either clicking on the pages listed below, or by using the keyword search tool below to find specific information within the annual report.-
 1
1 -
2
-
3
-
4
-
5
-
6
-
7
-
8
-
9
-
10
-
11
-
12
-
13
-
14
-
 15
15 -
 16
16 -
 17
17 -
 18
18 -
 19
19 -
 20
20 -
 21
21 -
 22
22 -
 23
23 -
 24
24 -
 25
25 -
 26
26 -
 27
27 -
 28
28 -
 29
29 -
 30
30 -
 31
31 -
 32
32 -
 33
33 -
 34
34 -
 35
35 -
36
-
37
-
38
-
39
-
40
-
41
-
42
-
43
-
44
-
45
-
46
-
47
-
48
-
49
-
50
-
51
-
52
-
53
-
54
-
55
-
56
-
57
-
58
-
59
-
60
-
61
-
62
-
63
-
64
-
65
-
66
-
67
-
68
-
69
-
70
-
71
-
72
-
73
-
74
-
75
-
76
-
77
-
78
-
79
-
80
-
81
-
82
-
83
-
84
-
85
-
86
-
87
-
88
-
89
-
90
-
91
-
92
-
93
-
94
-
95
-
96
-
97
-
98
-
99
-
100
 |
 |

SYSCO CORPORATION-Form10-K 17
PARTII
ITEM7Management’s Discussion and Analysis ofFinancial Condition and Results of Operations
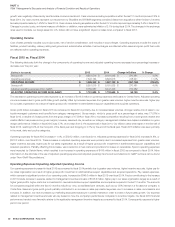
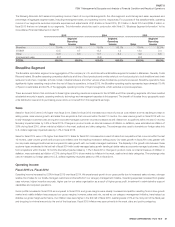
The following tables outline our expenses attributable to our integration planning, litigation and termination costs and nancing activities, for the periods
presented:
(In thousands)
2015 2014
Operating expense $ 554,667 $ 90,571
Interest expense 138,422 6,790
TOTAL $ 693,089 $ 97,361
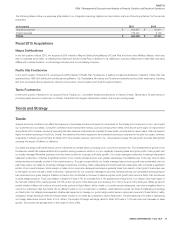
Fiscal 2015 Acquisitions
Mayca Distribuidores
In the rst quarter of scal 2015, we acquired a 50% interest in Mayca Distribuidores (Mayca) of Costa Rica and three other af liates. Mayca, which has
been in business since 1995, is a leading food distributor across Costa Rica. In addition to its distribution business, Mayca has a retail cash-and-carry
af liate with multiple locations, a cold-storage company and a truck-leasing company.
Paci c Star Foodservice
In the fourth quarter of scal 2015, we acquired a 50% interest in Paci c Star Foodservice, a leading foodservice distributor in Mexico. Paci c Star has
operated since 1989 with distribution centers servicing Mexico City, Guadalajara, Monterrey and Tijuana and primarily services chain restaurants, including
fast food and casual dining restaurants, casinos, theme parks, movie theaters and hotels throughout Mexico.
Tannis Foodservice
In the fourth quarter of scal 2015, we acquired Tannis Trading, Inc., a broadline foodservice distributor in Ottawa, Ontario. Tannis has a 75-year history of
providing quality service to customers in Ottawa, Canada’s fourth-largest metropolitan market, and the surrounding areas.
Trends and Strategy
Trends
General economic conditions can affect the frequency of purchases and amounts spent by consumers for food-away-from-home and, in turn, can impact
our customers and our sales. Consumer con dence and employment metrics, such as unemployment rates, have shown some signs of improvement
during scal 2015; however, consumer spending has been cautious. Fuel prices are currently at lower levels, as compared to recent years, that may support
higher consumer spending in the future. Overall, the market environment appears to be modestly improved as compared to the prior two years; however,
uncertainty in industry growth remains for scal 2016. One industry resource, Technomic, Inc., has projected roughly 2% real growth annually. Real growth
excludes the impact of in ation or de ation.
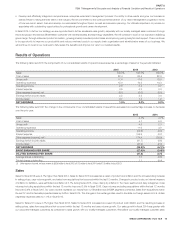
Our sales and gross pro t performance can be in uenced by multiple factors including price, volume and product mix. The modest level of growth in the
foodservice market has created additional competitive pricing pressures, which is, in turn, negatively impacting sales and gross pro ts. Case growth with
our locally-managed Broadline business is an important contributor to gross pro t dollar growth. Our locally-managed customers, including independent
restaurant customers, comprise a signi cant portion of our overall volumes and an even greater percentage of pro tability due to the high level of value
added services we typically provide to this customer group. Through focused efforts, our locally-managed case volume growth has accelerated over the
past three years. Our sales to corporate-managed customers, including chain restaurants and multi-locational restaurants, also comprise a signi cant
portion of our overall volumes. Gross margin on sales to our corporate-managed customers is generally lower than sales to other types of customers due
to the higher volumes we sell to these customers. Case growth for our corporate-managed customers remained strong, but competitive pricing pressure
has constrained our gross margins. In ation is a factor that contributes to the level of sales and gross pro t growth and can be a factor that contributes
to gross margin pressure. Food cost in ation in scal 2015 was 3.7%, an increase from 2.1% experienced in scal 2014. Our in ation rates were higher in
the rst half of scal 2015, reaching levels of 6.0% at the mid-point of the scal year and dropping to 0.1% by the end of the scal year. While we cannot
predict whether in ation will continue at current levels, periods of high in ation, either overall or in certain product categories, can have a negative effect on
us and our customers. High food costs can be dif cult to pass on to our customers. In addition, rapid declines in prices can make it challenging to leverage
our xed costs. Our category management initiative has helped us to manage our gross margin performance in response to several of these factors. Lastly,
changes in foreign exchange rates are having a larger impact on our sales as compared to recent scal years. The strengthening U.S. dollar is depressing
our foreign sales as we convert them to U.S. dollars. The impact of foreign exchange rates for scal 2015 was a 1.0% year-over-year decrease to sales
growth. This impact has typically been in the range of 0% to 0.5%.