Sysco 2015 Annual Report Download - page 31
Download and view the complete annual report
Please find page 31 of the 2015 Sysco annual report below. You can navigate through the pages in the report by either clicking on the pages listed below, or by using the keyword search tool below to find specific information within the annual report.-
 1
1 -
2
-
3
-
4
-
5
-
6
-
7
-
8
-
9
-
10
-
11
-
12
-
13
-
14
-
15
-
16
-
17
-
18
-
19
-
20
-
 21
21 -
 22
22 -
 23
23 -
 24
24 -
 25
25 -
 26
26 -
 27
27 -
 28
28 -
 29
29 -
 30
30 -
 31
31 -
 32
32 -
 33
33 -
 34
34 -
 35
35 -
 36
36 -
 37
37 -
 38
38 -
 39
39 -
 40
40 -
 41
41 -
42
-
43
-
44
-
45
-
46
-
47
-
48
-
49
-
50
-
51
-
52
-
53
-
54
-
55
-
56
-
57
-
58
-
59
-
60
-
61
-
62
-
63
-
64
-
65
-
66
-
67
-
68
-
69
-
70
-
71
-
72
-
73
-
74
-
75
-
76
-
77
-
78
-
79
-
80
-
81
-
82
-
83
-
84
-
85
-
86
-
87
-
88
-
89
-
90
-
91
-
92
-
93
-
94
-
95
-
96
-
97
-
98
-
99
-
100
 |
 |
SYSCO CORPORATION-Form10-K 23
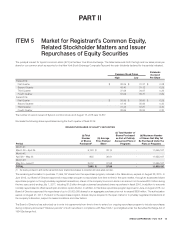
PARTII
ITEM7Management’s Discussion and Analysis ofFinancial Condition and Results of Operations
Certain Items Within Operating Expenses
Our signi cant Certain Items applicable for scal 2014 included costs in connection with the then proposed merger with US Foods, a change in the estimate
of our self-insurance reserve and a liability for a settlement, which were described in greater detail above. Our signi cant Certain Items applicable for
scal2013 related to withdrawal liabilities from multiemployer pension plans, severance charges and costs from restructuring executive retirement plans.
From time to time, we may voluntarily withdraw from multiemployer pension plans to minimize or limit our future exposure to these plans. In scal 2013,
we recorded a provision $41.9 million, related to multiemployer pension plan withdrawals.
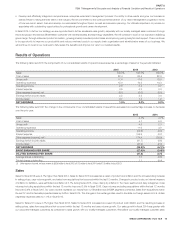
Net Earnings
Net earnings decreased 26.3% in scal 2015 from scal 2014 due primarily to the changes in operating income discussed above, including the impact
of Certain Items, which included increased interest expense of $131.6 million in scal 2015 that related to the nancing of our proposed merger with US
Foods. These amounts include the write off of unamortized debt issuance costs when our bridge acquisition facility was terminated upon the issuance of
our senior notes in October 2014 and interest expense on those senior notes. Excluding this interest expense, adjusted interest expense decreased by
$0.6 million. Adjusted net earnings increased $66.3 million, or 6.4%, during scal 2015.
Net earnings for scal 2014 decreased 6.1% compared to scal 2013. This decrease was primarily due to changes in operating income discussed above.
Adjusted net earnings decreased 1.8% during scal 2014.
The effective tax rate of 31.9% for scal 2015 was favorably impacted by lower earnings in the U.S. primarily due to costs associated with the termination
of the US Foods proposed merger. The lower U.S. earnings resulted in a more signi cant favorable impact on the effective tax rate from the inde nitely
reinvested foreign earnings due to lower foreign statutory tax rates as compared to the domestic tax rate. The additional cost associated with the proposed
US Foods merger resulted in lower state taxes. For future periods, we would expect our normalized tax rate to be in the range of 36% to 37%.
The effective tax rate of 36.9% for scal 2014 was negatively impacted primarily by two items. First, a non-deductible penalty, that the company incurred,
had an unfavorable tax impact of $6.2 million. Second, we recorded net tax expense of $5.2 million for tax and interest related to various federal, foreign and
state uncertain tax positions. This negative impact was partially offset by the recording of $5.7 million of tax bene t related to disqualifying dispositions of
Sysco stock pursuant to share-based compensation arrangements. Inde nitely reinvested earnings taxed at foreign statutory rates less than our domestic
tax rate also had the impact of reducing the effective tax rate.
The effective tax rate for scal 2013 was 35.9%. Inde nitely reinvested earnings taxed at foreign statutory tax rates less than our domestic tax rate had
the impact of reducing the effective tax rate.
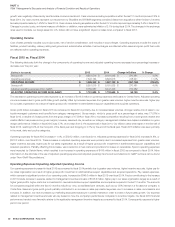
Earnings Per Share
Basic earnings per share in scal 2015 were $1.16, a 27.0% decrease from the scal 2014 amount of $1.59 per share. Diluted earnings per share in scal 2015
were $1.15, a 27.2% decrease from the scal 2014 amount of $1.58 per share. This decrease was primarily the result of the factors discussed above and
due to greater shares outstanding during scal 2015 as compared to scal 2014. As discussed below in “liquidity and capital resources - nancing activities,”
we chose not to repurchase any shares in scal 2015 due to the proposed US Foods merger. Our shares outstanding have increased primarily as a result
of stock option exercises and restricted stock unit grants to employees. This resulted in lowering our earnings per share amounts by $0.02pershare.
Adjusted diluted earnings per share in scal 2015 were $1.84, an increase of 5.1% from the comparable prior year period amount of $1.75.
Basic earnings per share in scal 2014 were $1.59, a 5.4% decrease from the scal 2013 amount of $1.68 per share. Diluted earnings per share in
scal2014 were $1.58, a 5.4% decrease from the scal 2013 amount of $1.67 per share. This decrease was primarily the result of the factors discussed
above. Adjusted diluted earnings per share in scal 2014, based on the Certain Items de nition for the scal 2014 and scal 2013 years, were $1.76,a
decrease of 1.1% from the comparable prior year period amount of $1.78. All earnings per share metrics for scal 2014 were partially impacted by a
greater number of shares outstanding. Sysco experienced a greater number of stock option exercises in scal 2014 as compared to scal 2013, which
increased the number of shares outstanding.
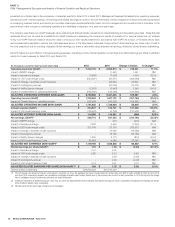
Non-GAAP Reconciliations and Adjusted Cost per Case
Sysco’s results of operations are impacted by multiemployer pension withdrawal charges, severance charges, integration planning, litigation costs and
termination costs in connection with the merger that had been proposed with US Foods, facility closure charges and US Foods related nancing costs.
Additional items in scal 2014 include a change in estimate of self-insurance, and charges from a contingency accrual. These scal 2015 and 2014 items
are collectively referred to as (Certain Items). Our US Foods nancing costs include the write off of unamortized debt issuance costs when our bridge
acquisition facility was terminated upon the issuance of our senior notes in October 2014 and interest expense on those senior notes. In scal 2014, costs
from executive retirement plans restructuring were included within Certain Items; however, because these costs in scal 2015 are comparable to scal
2014, these were not included in the Certain Items de nition for the comparison of adjusted results for scal 2015 to scal 2014. This continues to be