Sysco 2015 Annual Report Download - page 19
Download and view the complete annual report
Please find page 19 of the 2015 Sysco annual report below. You can navigate through the pages in the report by either clicking on the pages listed below, or by using the keyword search tool below to find specific information within the annual report.-
 1
1 -
2
-
3
-
4
-
5
-
6
-
7
-
8
-
 9
9 -
 10
10 -
 11
11 -
 12
12 -
 13
13 -
 14
14 -
 15
15 -
 16
16 -
 17
17 -
 18
18 -
 19
19 -
 20
20 -
 21
21 -
 22
22 -
 23
23 -
 24
24 -
 25
25 -
 26
26 -
 27
27 -
 28
28 -
 29
29 -
30
-
31
-
32
-
33
-
34
-
35
-
36
-
37
-
38
-
39
-
40
-
41
-
42
-
43
-
44
-
45
-
46
-
47
-
48
-
49
-
50
-
51
-
52
-
53
-
54
-
55
-
56
-
57
-
58
-
59
-
60
-
61
-
62
-
63
-
64
-
65
-
66
-
67
-
68
-
69
-
70
-
71
-
72
-
73
-
74
-
75
-
76
-
77
-
78
-
79
-
80
-
81
-
82
-
83
-
84
-
85
-
86
-
87
-
88
-
89
-
90
-
91
-
92
-
93
-
94
-
95
-
96
-
97
-
98
-
99
-
100
 |
 |

SYSCO CORPORATION-Form10-K 11
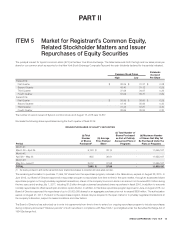
PARTI
ITEM2Properties
ITEM1B Unresolved Staff Comments
None.
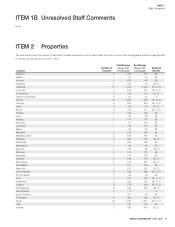
ITEM2 Properties
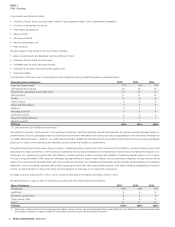
The table below shows the number of distribution facilities occupied by Sysco in each state, province or country and the aggregate square footage devoted
to cold and dry storage as of June 27, 2015.
Location
Number of
Facilities
Cold Storage
(Square Feet
inthousands)
Dry Storage
(Square Feet
inthousands)
Segment
Served*
Alabama 2 185 131 BL
Alaska 14128BL
Arizona 1 228 140 BL
Arkansas 2 130 88 BL, O
California 17 1,414 1,273 BL, S, O
Colorado 4 275 213 BL, S, O
Connecticut 3 156 110 BL, O
District of Columbia 25242O
Florida 15 1,236 974 BL, S, O
Georgia 5 267 416 BL, S, O
Idaho 3 95 92 BL, O
Illinois 6 410 411 BL, S, O
Indiana 1 100 109 BL
Iowa 19395BL
Kansas 1 177 171 BL
Kentucky 1 91 106 BL
Louisiana 1 134 113 BL
Maine 15850BL
Maryland 2 318 255 BL
Massachusetts 1 218 188 BL
Michigan 3 320 300 BL, S
Minnesota 3 233 195 BL
Mississippi 19569BL
Missouri 2 105 95 BL, S
Montana 1 121 121 BL
Nebraska 1 144 129 BL
Nevada 3 199 154 BL, O
New Jersey 5 143 502 BL, O
New Mexico 1 121 108 BL
New York 4 417 361 BL, O
North Carolina 6 325 308 BL, S, O
North Dakota 14659BL
Ohio 7 407 475 BL, S, O
Oklahoma 3 189 152 BL, S, O
Oregon 3 176 156 BL, S, O
Pennsylvania 5 542 405 BL, S
Rhode Island 12 -O
South Carolina 1 191 98 BL
Tennessee 5 406 426 BL, O
Texas 18 1,130 1,241 BL, S, O
Utah 1 161 107 BL
Virginia 3 628 419 BL, O