Sysco 2015 Annual Report Download - page 28
Download and view the complete annual report
Please find page 28 of the 2015 Sysco annual report below. You can navigate through the pages in the report by either clicking on the pages listed below, or by using the keyword search tool below to find specific information within the annual report.-
 1
1 -
2
-
3
-
4
-
5
-
6
-
7
-
8
-
9
-
10
-
11
-
12
-
13
-
14
-
15
-
16
-
17
-
 18
18 -
 19
19 -
 20
20 -
 21
21 -
 22
22 -
 23
23 -
 24
24 -
 25
25 -
 26
26 -
 27
27 -
 28
28 -
 29
29 -
 30
30 -
 31
31 -
 32
32 -
 33
33 -
 34
34 -
 35
35 -
 36
36 -
 37
37 -
 38
38 -
39
-
40
-
41
-
42
-
43
-
44
-
45
-
46
-
47
-
48
-
49
-
50
-
51
-
52
-
53
-
54
-
55
-
56
-
57
-
58
-
59
-
60
-
61
-
62
-
63
-
64
-
65
-
66
-
67
-
68
-
69
-
70
-
71
-
72
-
73
-
74
-
75
-
76
-
77
-
78
-
79
-
80
-
81
-
82
-
83
-
84
-
85
-
86
-
87
-
88
-
89
-
90
-
91
-
92
-
93
-
94
-
95
-
96
-
97
-
98
-
99
-
100
 |
 |

SYSCO CORPORATION-Form10-K20
PARTII
ITEM7Management’s Discussion and Analysis ofFinancial Condition and Results of Operations
growth was negatively in uenced by less favorable consumer sentiment. Case volumes excluding acquisitions within the last 12 months improved 2.2% in
scal 2014. Our case volumes represent our results from our Broadline and SYGMA segments combined. Sales from acquisitions within the last 12 months
favorably impacted sales by 1.4%% for scal 2014. Case volumes including acquisitions within the last 12 months improved approximately 3.4% in scal 2014.
Changes in product costs, an internal measure of in ation or de ation, were estimated as in ation of 2.1% during scal 2014. The changes in the exchange
rates used to translate our foreign sales into U.S. dollars did not have a signi cant impact on sales when compared to scal 2013.
Operating Income
Cost of sales primarily includes our product costs, net of vendor consideration, and includes in-bound freight. Operating expenses include the costs of
facilities, product handling, delivery, selling and general and administrative activities. Fuel surcharges are re ected within sales and gross pro t; fuel costs
are re ected within operating expenses.
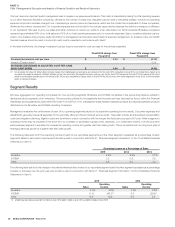
Fiscal 2015 vs. Fiscal 2014
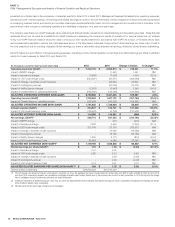
The following table sets forth the change in the components of operating income and adjusted operating income expressed as a percentage increase or
decrease over the prior year:
(Dollars in thousands)
2015 2014 Change in Dollars % Change
Gross pro t $ 8,551,516 $ 8,181,035 $ 370,481 4.5%
Operating expenses 7,322,154 6,593,913 728,241 11.0%
OPERATING INCOME $ 1,229,362 $ 1,587,122 $ (357,760) (22.5)%
Gross pro t $ 8,551,516 $ 8,181,035 $ 370,481 4.5%
Adjusted operating expenses (Non-GAAP) 6,759,687 6,447,405 312,282 -
ADJUSTED OPERATING INCOME (NON-GAAP) $ 1,791,829 $ 1,733,630 $ 58,199 3.4%
The decrease in operating income was impacted by an increase of $416.0 million in operating expenses attributable to Certain Items. Adjusted operating
income increased due to gross pro t dollar growth partially offset by increased expenses from greater case volumes, higher incentive accruals, higher pay
for our sales organization as a result of higher gross pro t, investment in administrative support capabilities and acquired operations.
Gross pro t dollars increased in scal 2015 as compared to scal 2014 primarily due to increased sales volumes, stronger relative mix of sales to our
locally-managed customers and bene ts from category management. Gross margin, which is gross pro t as a percentage of sales, was 17.57% in
scal2015, a decline of 2 basis points from the gross margin of 17.59% in scal 2014. Increased competition resulting from a slow-growth market and
volatile in ation has pressured our gross margins; however, sales and mix, as well as our category management initiative have helped us stabilize our gross
margin performance. In ation in scal 2015 was 3.7%, an increase from 2.1% experienced in scal 2014. Our in ation rates were higher in the rst half of
scal 2015, reaching 6.0% at the mid-point of the scal year and dropping to 0.1% by the end of the scal year. Fiscal 2015 in ation was seen primarily
in the meat, dairy and poultry categories.
Operating expenses for scal 2015 increased 11.0%, or $728.2 million, over scal 2014. Adjusted operating expenses for scal 2015 increased 4.8%, or
$312.3 million, over scal 2014. These increases in adjusted operating expenses were primarily due to increased expenses from greater case volumes,
higher incentive accruals, higher pay for our sales organization as a result of higher gross pro t, investment in administrative support capabilities and
acquired operations. Partially offsetting this increase, was a reduction in fuel costs and provisions for losses on receivables. Sysco’s operating expenses
were impacted by Certain Items, which resulted in an increase in operating expenses of $416 million in scal 2015 as compared to scal 2014. More
information on the rationale of the use of adjusted operating expense and adjusted operating income and reconciliations to GAAP numbers can be found
under “Non-GAAP Reconciliations.”
Operating Expenses Impacting Adjusted Operating Income
Our operating expenses increased in scal 2015 as compared to scal 2014 partially due to greater case volumes, higher incentive accruals, higher pay for
our sales organization as a result of higher gross pro t, investment in administrative support capabilities and acquired operations. Pay-related expenses,
which represent a signi cant portion of our operating costs, increased by $349.3 million in scal 2015 over scal 2014. Factors contributing to the increase
in 2015 include increase in expense related to management incentive accruals of $103.5 million, higher pay in our sales organization largely as a result of
higher gross pro ts, higher costs due to investment in new administrative support capabilities and companies acquired in the last 12 months. The amounts
for companies acquired within the last 12 months include our new, consolidated joint ventures, such as our 50% interest in a foodservice company in
Costa Rica. Sales and gross pro t growth partially contributed to an increase in sales pay-related expenses due to increases in sales commissions and
bonuses. In addition, we have increased our marketing associate headcount in certain markets in order to invest in future sales growth. Our expense
related to management incentive accruals will vary based on how the company’s performance compares to incentive targets. Our scal 2015 nancial
performance trended more favorably relative to the applicable management incentive targets as compared to scal 2014. Consequently, expense is higher
period over period.