Sysco 2015 Annual Report Download - page 63
Download and view the complete annual report
Please find page 63 of the 2015 Sysco annual report below. You can navigate through the pages in the report by either clicking on the pages listed below, or by using the keyword search tool below to find specific information within the annual report.-
 1
1 -
2
-
3
-
4
-
5
-
6
-
7
-
8
-
9
-
10
-
11
-
12
-
13
-
14
-
15
-
16
-
17
-
18
-
19
-
20
-
21
-
22
-
23
-
24
-
25
-
26
-
27
-
28
-
29
-
30
-
31
-
32
-
33
-
34
-
35
-
36
-
37
-
38
-
39
-
40
-
41
-
42
-
43
-
44
-
45
-
46
-
47
-
48
-
49
-
50
-
51
-
52
-
 53
53 -
 54
54 -
 55
55 -
 56
56 -
 57
57 -
 58
58 -
 59
59 -
 60
60 -
 61
61 -
 62
62 -
 63
63 -
 64
64 -
 65
65 -
 66
66 -
 67
67 -
 68
68 -
 69
69 -
 70
70 -
 71
71 -
 72
72 -
 73
73 -
74
-
75
-
76
-
77
-
78
-
79
-
80
-
81
-
82
-
83
-
84
-
85
-
86
-
87
-
88
-
89
-
90
-
91
-
92
-
93
-
94
-
95
-
96
-
97
-
98
-
99
-
100
 |
 |

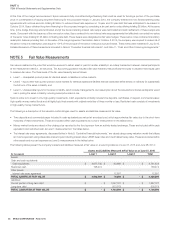
SYSCO CORPORATION-Form10-K 55
PARTII
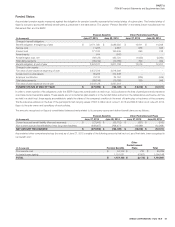
ITEM8Financial Statements and Supplementary Data
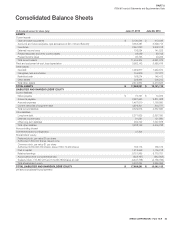
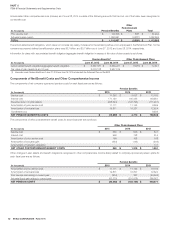
(Inthousands)
Assets and Liabilities Measured at Fair Value as of June 28, 2014
Level1 Level2 Level3 Total
Assets:
Cash and cash equivalents
Cash equivalents $ 2,770 $ 131,966 $ - $ 134,736
Restricted cash 145,412 - - 145,412
Other assets
Interest rate swap agreement - 4,828 - 4,828
TOTAL ASSETS AT FAIR VALUE $ 148,182 $ 136,794 $ - $ 284,976
Liabilities:
Accrued expenses
Interest rate swap agreements $ - $ 133,466 $ - $ 133,466
TOTAL LIABILITIES AT FAIR VALUE $ - $ 133,466 $ - $ 133,466
The carrying values of accounts receivable and accounts payable approximated their respective fair values due to the short-term maturities of these
instruments. The fair value of Sysco’s total debt is estimated based on the quoted market prices for the same or similar issue or on the current rates offered
to the company for debt of the same remaining maturities and is considered a Level 2 measurement. The fair value of total debt approximated $7.6 billion
and $3.0 billion as of June 27, 2015 and June 28, 2014, respectively. The carrying value of total debt was $7.3 billion and $2.7 billion as of June 27, 2015
and June 28, 2014, respectively.
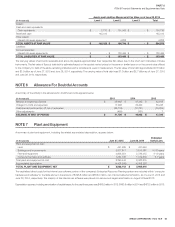
NOTE6 Allowance For Doubtful Accounts
A summary of the activity in the allowance for doubtful accounts appears below:
(Inthousands)
2015 2014 2013
Balance at beginning of period $ 49,902 $ 47,345 $ 42,919
Charged to costs and expenses 17,996 34,429 35,243
Customer accounts written off, net of recoveries (25,719) (31,721) (30,824)
Other adjustments (459) (151) 7
BALANCE AT END OF PERIOD $ 41,720 $ 49,902 $ 47,345
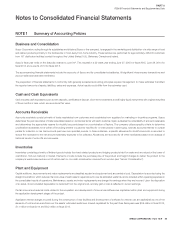
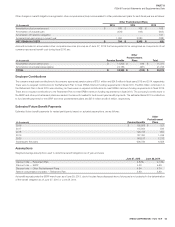
NOTE7 Plant and Equipment
A summary of plant and equipment, including the related accumulated depreciation, appears below:
(Inthousands)
June 27, 2015 June 28, 2014
Estimated
Useful Lives
Plant and equipment at cost:
Land $ 441,939 $ 431,694
Buildings and improvements 3,877,817 3,816,387 10-30 years
Fleet and equipment 2,836,554 2,726,415 3-10 years
Computer hardware and software 1,234,138 1,109,379 3-7 years
Total plant and equipment at cost 8,390,448 8,083,875
Accumulated depreciation (4,408,305) (4,098,257)
TOTAL PLANT AND EQUIPMENT, NET $ 3,982,143 $ 3,985,618
The capitalized direct costs for the internal use software portion of the company’s Enterprise Resource Planning system are included within “computer
hardware and software” in the table above in the amount of $293.8 million and $355.2 million, net of accumulated amortization, as of June 27, 2015 and
June 28, 2014, respectively. The majority of this internal use software was placed into service and began amortization in August of scal 2013.
Depreciation expense, including amortization of capital leases, for the past three years was $495.8 million in 2015, $493.8 million in 2014 and $473.5 million in 2013.