Sysco 2015 Annual Report Download - page 37
Download and view the complete annual report
Please find page 37 of the 2015 Sysco annual report below. You can navigate through the pages in the report by either clicking on the pages listed below, or by using the keyword search tool below to find specific information within the annual report.-
 1
1 -
2
-
3
-
4
-
5
-
6
-
7
-
8
-
9
-
10
-
11
-
12
-
13
-
14
-
15
-
16
-
17
-
18
-
19
-
20
-
21
-
22
-
23
-
24
-
25
-
26
-
 27
27 -
 28
28 -
 29
29 -
 30
30 -
 31
31 -
 32
32 -
 33
33 -
 34
34 -
 35
35 -
 36
36 -
 37
37 -
 38
38 -
 39
39 -
 40
40 -
 41
41 -
 42
42 -
 43
43 -
 44
44 -
 45
45 -
 46
46 -
 47
47 -
48
-
49
-
50
-
51
-
52
-
53
-
54
-
55
-
56
-
57
-
58
-
59
-
60
-
61
-
62
-
63
-
64
-
65
-
66
-
67
-
68
-
69
-
70
-
71
-
72
-
73
-
74
-
75
-
76
-
77
-
78
-
79
-
80
-
81
-
82
-
83
-
84
-
85
-
86
-
87
-
88
-
89
-
90
-
91
-
92
-
93
-
94
-
95
-
96
-
97
-
98
-
99
-
100
 |
 |

SYSCO CORPORATION-Form10-K 29
PARTII
ITEM7Management’s Discussion and Analysis ofFinancial Condition and Results of Operations
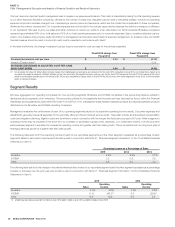
Operating income decreased by 26.9% in scal 2014 from scal 2013. Gross pro t dollars increased 2.8% while operating expenses increased 6.5% in
scal 2014 over scal 2013. These gross pro t results largely re ect the sluggish sales environment that existed at that time. Operating expenses increased
in scal 2014 largely due to increased delivery costs including pay-related expenses. Our enhanced de ned contribution plan became effective January 1,
2013 and contributed to the increase in pay-related expense.
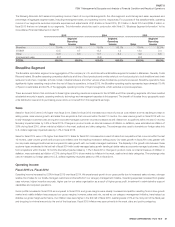
Other Segment
“Other” nancial information is attributable to our other operating segments, including our specialty produce, our custom-cut meat operations, lodging
industry products segments, a company that distributes specialty imported products, a company that distributes to international customers and our Sysco
Ventures platform, our suite of technology solutions that help support the business needs of our customers. These operating segments are discussed on
an aggregate basis as they do not represent reportable segments under segment accounting literature.
On an aggregate basis, our “Other” segment has had a lower operating income as a percentage of sales than Sysco’s Broadline segment. Sysco has
acquired some of the operating companies within this segment in recent years. These operations generally operate in a niche within the foodservice industry
except for our lodging industry supply company. Each individual operation is also generally smaller in sales and scope than an average Broadline operation
and each of these operating segments is considerably smaller in sales and overall scope than the Broadline segment. In scal 2015, in the aggregate,
the “Other” segment represented approximately 10.8% of Sysco’s overall sales and 5.0% of the aggregate operating income of Sysco’s segments, which
excludes corporate expenses and adjustments.
Operating income decreased 4.6%, or $6.5 million, in scal 2015 as compared to scal 2014. The decrease in operating income was largely due to startup
costs from our Iowa Premium Beef operations, partially offset by increased earnings from our specialty produce and custom-cut meat segments.
Operating income decreased 2.2% for scal 2014 over scal 2013. The decrease in operating income was largely due to startup costs from our Sysco
Ventures operations, partially offset by increased earnings from our specialty produce and lodging industry products segments. Additionally, retirement-
related expenses were greater for these companies for scal 2014 as our enhanced de ned contribution plan became effective January 1, 2013, and some
of these operations were not a part of prior bene t plans.
Liquidity and Capital Resources
Highlights
Comparisons of the cash ows from scal 2015 to scal 2014:
•Cash ows from operations were $1.6 billion this year compared to $1.5 billion last year.
•Net capital expenditures totaled $518.4 million this year compared to $497.4 million last year.
•
Free cash ow was $1.0 billion this year compared to $995.4 million last year (see Non-GAAP reconciliation below under the heading “Free Cash Flow”).
•Cash used for acquisition of businesses was $115.9 million this year compared to $79.3 million last year.
•Net bank borrowings were a net repayment of $130.0 million this year compared to a net borrowing of $34.5 million last year.
•Proceeds from exercises of share-based compensation awards were $240.2 million this year compared to $255.6 million last year.
•Treasury stock purchases were zero this year compared to $332.4 million last year.
•Dividends paid were $695.3 million this year compared to $667.2 million last year.
Sources and Uses of Cash
Sysco’s strategic objectives include continuous investment in our business; these investments are funded by a combination of cash from operations and
access to capital from nancial markets. Our operations historically have produced signi cant cash ow. Cash generated from operations is generally
allocated to:
•working capital requirements;
•investments in facilities, systems, eet, other equipment and technology;
•return of capital to shareholders, including cash dividends and share repurchases;
•acquisitions compatible with our overall growth strategy;
•contributions to our various retirement plans; and
•debt repayments.