Sysco 2015 Annual Report Download - page 89
Download and view the complete annual report
Please find page 89 of the 2015 Sysco annual report below. You can navigate through the pages in the report by either clicking on the pages listed below, or by using the keyword search tool below to find specific information within the annual report.-
 1
1 -
2
-
3
-
4
-
5
-
6
-
7
-
8
-
9
-
10
-
11
-
12
-
13
-
14
-
15
-
16
-
17
-
18
-
19
-
20
-
21
-
22
-
23
-
24
-
25
-
26
-
27
-
28
-
29
-
30
-
31
-
32
-
33
-
34
-
35
-
36
-
37
-
38
-
39
-
40
-
41
-
42
-
43
-
44
-
45
-
46
-
47
-
48
-
49
-
50
-
51
-
52
-
53
-
54
-
55
-
56
-
57
-
58
-
59
-
60
-
61
-
62
-
63
-
64
-
65
-
66
-
67
-
68
-
69
-
70
-
71
-
72
-
73
-
74
-
75
-
76
-
77
-
78
-
 79
79 -
 80
80 -
 81
81 -
 82
82 -
 83
83 -
 84
84 -
 85
85 -
 86
86 -
 87
87 -
 88
88 -
 89
89 -
 90
90 -
 91
91 -
 92
92 -
 93
93 -
 94
94 -
 95
95 -
 96
96 -
 97
97 -
 98
98 -
 99
99 -
100
 |
 |

SYSCO CORPORATION-Form10-K 81
PARTII
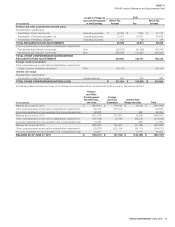
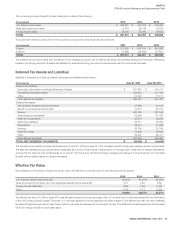
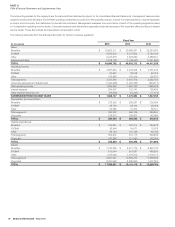
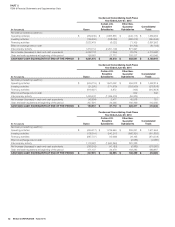
ITEM8Financial Statements and Supplementary Data
(Inthousands)
Condensed Consolidating Statement of Comprehensive Income
Year Ended June 27, 2015
Sysco
Certain U.S.
Broadline
Subsidiaries
Other Non-
Guarantor
Subsidiaries Eliminations
Consolidated
Totals
Sales $ - $ 32,626,221 $ 17,477,986 $ (1,423,455) $ 48,680,752
Cost of sales - 26,572,257 14,980,434 (1,423,455) 40,129,236
Gross pro t - 6,053,964 2,497,552 - 8,551,516
Operating expenses 1,232,956 3,709,320 2,379,878 - 7,322,154
Operating income (loss) (1,232,956) 2,344,644 117,674 - 1,229,362
Interest expense (income) 323,918 (108,233) 39,122 - 254,807
Other expense (income), net (9,496) (3,609) (20,487) - (33,592)
Earnings (losses) before income taxes (1,547,378) 2,456,486 99,039 - 1,008,147
Income tax (bene t) provision (493,263) 783,066 31,571 - 321,374
Equity in earnings of subsidiaries 1,740,888 - - (1,740,888) -
Net earnings 686,773 1,673,420 67,468 (1,740,888) 686,773
Other comprehensive income (loss) (280,534) - (232,185) 232,185 (280,534)
COMPREHENSIVE INCOME $ 406,239 $ 1,673,420 $ (164,717) $ (1,508,703) $ 406,239
(Inthousands)
Condensed Consolidating Statement of Comprehensive Income
Year Ended June 28, 2014
Sysco
Certain U.S.
Broadline
Subsidiaries
Other Non-
Guarantor
Subsidiaries Eliminations
Consolidated
Totals
Sales $ - $ 30,741,979 $ 16,979,494 $ (1,204,761) $ 46,516,712
Cost of sales - 24,990,377 14,550,061 (1,204,761) 38,335,677
Gross pro t - 5,751,602 2,429,433 - 8,181,035
Operating expenses 804,177 3,520,577 2,269,159 - 6,593,913
Operating income (loss) (804,177) 2,231,025 160,274 - 1,587,122
Interest expense (income) 232,140 (102,086) (6,313) - 123,741
Other expense (income), net (7,434) 217 (5,026) - (12,243)
Earnings (losses) before income taxes (1,028,883) 2,332,894 171,613 - 1,475,624
Income tax (bene t) provision (379,369) 860,184 63,276 - 544,091
Equity in earnings of subsidiaries 1,581,047 - - (1,581,047) -
Net earnings 931,533 1,472,710 108,337 (1,581,047) 931,533
Other comprehensive income (loss) (195,726) - (3,106) 3,106 (195,726)
COMPREHENSIVE INCOME $ 735,807 $ 1,472,710 $ 105,231 $ (1,577,941) $ 735,807
(Inthousands)
Condensed Consolidating Statement of Comprehensive Income
Year Ended June 29, 2013
Sysco
Certain U.S.
Broadline
Subsidiaries
Other Non-
Guarantor
Subsidiaries Eliminations
Consolidated
Totals
Sales $ - $ 30,162,329 $ 15,335,180 $ (1,086,276) $ 44,411,233
Cost of sales - 24,385,677 13,115,225 (1,086,276) 36,414,626
Gross pro t - 5,776,652 2,219,955 - 7,996,607
Operating expenses 694,323 3,610,907 2,032,899 - 6,338,129
Operating income (loss) (694,323) 2,165,745 187,056 - 1,658,478
Interest expense (income) 298,474 (177,421) 7,442 - 128,495
Other expense (income), net (12,864) (4,554) (54) - (17,472)
Earnings (losses) before income taxes (979,933) 2,347,720 179,668 - 1,547,455
Income tax (bene t) provision (351,474) 842,062 64,440 - 555,028
Equity in earnings of subsidiaries 1,620,886 - - (1,620,886) -
Net earnings 992,427 1,505,658 115,228 (1,620,886) 992,427
Other comprehensive income (loss) 215,929 - (33,191) 33,191 215,929
COMPREHENSIVE INCOME $ 1,208,356 $ 1,505,658 $ 82,037 $ (1,587,695) $ 1,208,356