Sysco 2015 Annual Report Download - page 34
Download and view the complete annual report
Please find page 34 of the 2015 Sysco annual report below. You can navigate through the pages in the report by either clicking on the pages listed below, or by using the keyword search tool below to find specific information within the annual report.-
 1
1 -
2
-
3
-
4
-
5
-
6
-
7
-
8
-
9
-
10
-
11
-
12
-
13
-
14
-
15
-
16
-
17
-
18
-
19
-
20
-
21
-
22
-
23
-
 24
24 -
 25
25 -
 26
26 -
 27
27 -
 28
28 -
 29
29 -
 30
30 -
 31
31 -
 32
32 -
 33
33 -
 34
34 -
 35
35 -
 36
36 -
 37
37 -
 38
38 -
 39
39 -
 40
40 -
 41
41 -
 42
42 -
 43
43 -
 44
44 -
45
-
46
-
47
-
48
-
49
-
50
-
51
-
52
-
53
-
54
-
55
-
56
-
57
-
58
-
59
-
60
-
61
-
62
-
63
-
64
-
65
-
66
-
67
-
68
-
69
-
70
-
71
-
72
-
73
-
74
-
75
-
76
-
77
-
78
-
79
-
80
-
81
-
82
-
83
-
84
-
85
-
86
-
87
-
88
-
89
-
90
-
91
-
92
-
93
-
94
-
95
-
96
-
97
-
98
-
99
-
100
 |
 |

SYSCO CORPORATION-Form10-K26
PARTII
ITEM7Management’s Discussion and Analysis ofFinancial Condition and Results of Operations
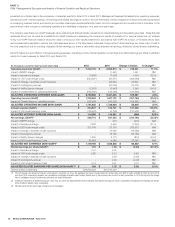
Cost per case is an important metric management uses to measure our expense performance. This metric is calculated by taking the total operating expense
of our North American Broadline companies, divided by the number of cases sold. Adjusted cost per case is calculated similarly, however the operating
expense component excludes charges from, multiemployer pension plans and severance, which are the Certain Items applicable to these companies,
divided by the number of cases sold. Our corporate expenses are not included in the cost per cases metrics because the metric is a measure of ef ciency
in our operations. We seek to grow our sales and either minimize or reduce our costs on a per case basis. Our North American Broadline companies
represent approximately 80% of our total sales and 75% of our total operating expenses prior to corporate expenses. Sysco considers adjusted cost per
case to be a measure that provides useful information to management and investors about Sysco’s expense management. An analysis of any non-GAAP
nancial measure should be used in conjunction with results presented in accordance with GAAP.
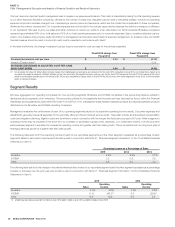
In the table that follows, the change in adjusted cost per case is reconciled to cost per case for the periods presented.
Fiscal 2015 change from
Fiscal 2014
Fiscal 2014 change from
Fiscal 2013
Increase (decrease) in cost per case $ 0.04 $ (0.10)
Impact of Certain Items(1) - 0.04
INCREASE (DECREASE) IN ADJUSTED COST PER CASE
(NON-GAAP BASIS) $ 0.04 $ (0.06)
(1) For all periods, the impact of Certain Items excludes charges from multiemployer pension plans and severance. For the fiscal 2015 comparison to fiscal 2014, our Certain Items charges were
not significant enough to contribute a different adjusted cost per case result from the reported increase in cost per case. For the fiscal 2014 comparison to fiscal 2013, the majority of the impact
relates to multiemployer pension plans in the amount of $0.04 per case attributable to charges taken in fiscal 2014 that did not recur at the same magnitude in fiscal 2013, and the remainder
relates to severance charges.
Segment Results
We have aggregated our operating companies into two reporting segments, Broadline and SYGMA, as de ned in the accounting literature related to
disclosures about segments of an enterprise. The accounting policies for the segments are the same as those disclosed by Sysco within the Financial
Statements and Supplementary Data within Part II Item 8 of this Form 10-K. Intersegment sales represent specialty produce and imported specialty products
distributed by the Broadline and SYGMA operating companies.
Management evaluates the performance of each of our operating segments based on its respective operating income results. Corporate expenses and
adjustments generally include all expenses of the corporate of ce and Sysco’s shared service center. These also include all share-based compensation
costs and integration planning, litigation costs and termination costs in connection with the merger that had been proposed US Foods. While a segment’s
operating income may be impacted in the short-term by increases or decreases in gross pro ts, expenses, or a combination thereof, over the long-term
each business segment is expected to increase its operating income at a greater rate than sales growth. This is consistent with our long-term goal of
leveraging earnings growth at a greater rate than sales growth.
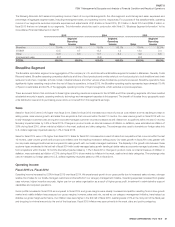
The following table sets forth the operating income of each of our reportable segments and the other segment expressed as a percentage of each
segment’s sales for each period reported and should be read in conjunction with Note 21, “Business Segment Information” to the Consolidated Financial
Statements in Item 8:
Operating Income as a Percentage of Sales
2015 2014 2013
Broadline 6.6% 6.6% 6.7%
SYGMA 0.3 0.6 0.9
Other 2.6 3.0 3.2
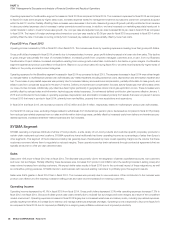
The following table sets forth the change in the selected nancial data of each of our reportable segments and the other segment expressed as a percentage
increase or decrease over the prior year and should be read in conjunction with Note 21, “Business Segment Information” to the Consolidated Financial
Statements in Item 8:
2015 2014
Sales
Operating
Income Sales
Operating
Income
Broadline 5.0% 5.8% 4.3% 2.8%
SYGMA (1.6) (46.1)(1) 6.9 (26.9)(1)
Other 12.6 (4.6) 6.6 2.2
(1) SYGMA had operating income of $20.5 million in fiscal 2015, $38.0 million in fiscal 2014 and $52.0 million in fiscal 2013.