Sysco 2015 Annual Report Download - page 83
Download and view the complete annual report
Please find page 83 of the 2015 Sysco annual report below. You can navigate through the pages in the report by either clicking on the pages listed below, or by using the keyword search tool below to find specific information within the annual report.-
 1
1 -
2
-
3
-
4
-
5
-
6
-
7
-
8
-
9
-
10
-
11
-
12
-
13
-
14
-
15
-
16
-
17
-
18
-
19
-
20
-
21
-
22
-
23
-
24
-
25
-
26
-
27
-
28
-
29
-
30
-
31
-
32
-
33
-
34
-
35
-
36
-
37
-
38
-
39
-
40
-
41
-
42
-
43
-
44
-
45
-
46
-
47
-
48
-
49
-
50
-
51
-
52
-
53
-
54
-
55
-
56
-
57
-
58
-
59
-
60
-
61
-
62
-
63
-
64
-
65
-
66
-
67
-
68
-
69
-
70
-
71
-
72
-
 73
73 -
 74
74 -
 75
75 -
 76
76 -
 77
77 -
 78
78 -
 79
79 -
 80
80 -
 81
81 -
 82
82 -
 83
83 -
 84
84 -
 85
85 -
 86
86 -
 87
87 -
 88
88 -
 89
89 -
 90
90 -
 91
91 -
 92
92 -
 93
93 -
94
-
95
-
96
-
97
-
98
-
99
-
100
 |
 |

SYSCO CORPORATION-Form10-K 75
PARTII
ITEM8Financial Statements and Supplementary Data
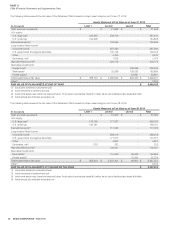
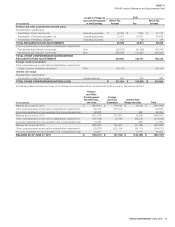
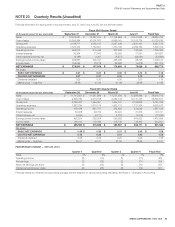
The income tax provision/(bene t) for each scal year consists of the following:
(Inthousands)
2015 2014 2013
U.S. federal income taxes $ 285,807 $ 433,795 $ 439,667
State and local income taxes (2,737) 55,736 69,759
Foreign income taxes 38,304 54,560 45,602
TOTAL $ 321,374 $ 544,091 $ 555,028
The current and deferred components of the income tax provisions for each scal year are as follows:
(Inthousands)
2015 2014 2013
Current $ 327,639 $ 574,760 $ 582,889
Deferred (6,265) (30,669) (27,861)
TOTAL $ 321,374 $ 544,091 $ 555,028
The deferred tax provisions result from the effects of net changes during the year in deferred tax assets and liabilities arising from temporary differences
between the carrying amounts of assets and liabilities for nancial reporting purposes and the amounts used for income tax purposes.
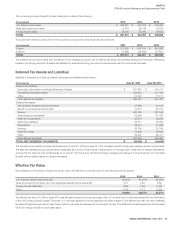
Deferred Tax Assets and Liabilities
Signi cant components of Sysco’s deferred tax assets and liabilities are as follows:
(Inthousands)
June 27, 2015 June 28, 2014
Deferred tax liabilities:
Excess tax depreciation and basis differences of assets $ 381,875 $ 416,417
Goodwill and intangible assets 224,943 211,434
Other 23,449 15,171
Total deferred tax liabilities 630,267 643,022
Deferred tax assets:
Net operating tax state loss carryforwards 47,958 20,123
Bene t on unrecognized tax bene ts 16,270 22,170
Pension 264,780 287,046
Share-based compensation 42,569 41,262
Deferred compensation 35,573 33,280
Self-insured liabilities 65,617 65,002
Receivables 38,410 47,688
Inventory 68,186 62,799
Cash ow hedge 74,900 56,826
Other 29,667 26,471
Total deferred tax assets 683,930 662,667
TOTAL NET DEFERRED TAX (ASSETS) $ (53,663) $ (19,645)
The company’s net operating tax loss carryforwards as of June 27, 2015 and June 28, 2014 consisted primarily of state net operating tax loss carryforwards.
The state net operating tax loss carryforwards outstanding as of June 27, 2015 expire in scal years 2017 through 2035. There were no valuation allowances
recorded for the state tax loss carryforwards as of June 27, 2015 and June 28, 2014 because management believes it is more likely than not that these
bene ts will be realized based on utilization forecasts.
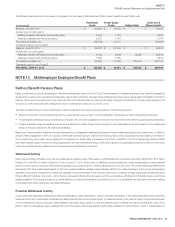
Effective Tax Rates
Reconciliations of the statutory federal income tax rate to the effective income tax rates for each scal year are as follows:
2015 2014 2013
U.S. statutory federal income tax rate 35.00% 35.00% 35.00%
State and local income taxes, net of any applicable federal income tax bene t 0.91 2.82 2.59
Foreign tax rate differential (2.84) (1.66) (1.22)
Other (1.19) 0.71 (0.50)
31.88% 36.87% 35.87%
The effective tax rate of 31.9% for scal 2015 was favorably impacted by lower earnings in the U.S. primarily due to costs associated with the termination
of the US Foods proposed merger. The lower U.S. earnings resulted in a more signi cant favorable impact on the effective tax rate from the inde nitely
reinvested foreign earnings due to lower foreign statutory tax rates as compared to the domestic tax rate. The additional cost associated with the proposed
US Foods merger resulted in lower state taxes.