Sysco 2015 Annual Report Download - page 56
Download and view the complete annual report
Please find page 56 of the 2015 Sysco annual report below. You can navigate through the pages in the report by either clicking on the pages listed below, or by using the keyword search tool below to find specific information within the annual report.-
 1
1 -
2
-
3
-
4
-
5
-
6
-
7
-
8
-
9
-
10
-
11
-
12
-
13
-
14
-
15
-
16
-
17
-
18
-
19
-
20
-
21
-
22
-
23
-
24
-
25
-
26
-
27
-
28
-
29
-
30
-
31
-
32
-
33
-
34
-
35
-
36
-
37
-
38
-
39
-
40
-
41
-
42
-
43
-
44
-
45
-
 46
46 -
 47
47 -
 48
48 -
 49
49 -
 50
50 -
 51
51 -
 52
52 -
 53
53 -
 54
54 -
 55
55 -
 56
56 -
 57
57 -
 58
58 -
 59
59 -
 60
60 -
 61
61 -
 62
62 -
 63
63 -
 64
64 -
 65
65 -
 66
66 -
67
-
68
-
69
-
70
-
71
-
72
-
73
-
74
-
75
-
76
-
77
-
78
-
79
-
80
-
81
-
82
-
83
-
84
-
85
-
86
-
87
-
88
-
89
-
90
-
91
-
92
-
93
-
94
-
95
-
96
-
97
-
98
-
99
-
100
 |
 |

SYSCO CORPORATION-Form10-K48
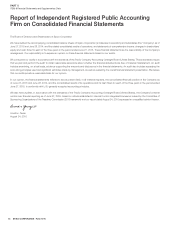
PARTII
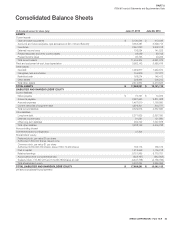
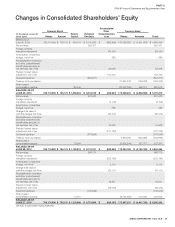
ITEM8Financial Statements and Supplementary Data
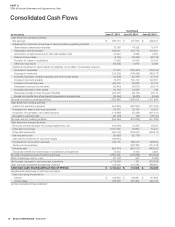
Consolidated Cash Flows
(Inthousands)
Year Ended
June 27, 2015 June 28, 2014 June 29, 2013
Cash ows from operating activities:
Net earnings $ 686,773 $ 931,533 $ 992,427
Adjustments to reconcile net earnings to cash provided by operating activities:
Share-based compensation expense 73,766 74,328 70,147
Depreciation and amortization 553,021 547,776 510,061
Amortization of debt issuance and other debt-related costs 27,943 8,286 2,487
Deferred income taxes (4,705) (30,665) (28,129)
Provision for losses on receivables 17,996 34,429 35,243
Other non-cash items (24,205) 2,875 2,485
Additional investment in certain assets and liabilities, net of effect of businesses acquired:
(Increase) in receivables (11,741) (236,320) (193,755)
(Increase) in inventories (125,232) (195,845) (180,277)
(Increase) decrease in prepaid expenses and other current assets (10,508) (24,787) 21,704
Increase in accounts payable 72,516 392,720 204,861
Increase in accrued expenses 464,403 55,838 67,015
(Decrease) in accrued income taxes (32,843) (18,672) (38,017)
(Increase) decrease in other assets (10,745) 23,552 182
(Decrease) increase in other long-term liabilities (105,501) (63,753) 49,716
Excess tax bene ts from share-based compensation arrangements (15,454) (8,480) (4,556)
Net cash provided by operating activities 1,555,484 1,492,815 1,511,594
Cash ows from investing activities:
Additions to plant and equipment (542,830) (523,206) (511,862)
Proceeds from sales of plant and equipment 24,472 25,790 15,527
Acquisition of businesses, net of cash acquired (115,862) (79,338) (397,447)
(Increase) in restricted cash (20,126) (84) (18,100)
Net cash used for investing activities (654,346) (576,838) (911,882)
Cash ows from nancing activities:
Bank and commercial paper borrowings (repayments), net (129,999) 34,499 95,500
Other debt borrowings 5,041,032 36,830 61,467
Other debt repayments (354,007) (229,507) (294,514)
Debt issuance costs (30,980) (22,175) -
Cash paid for settlement of cash ow hedges (188,840) - -
Proceeds from stock option exercises 240,176 255,613 628,652
Treasury stock purchases - (332,381) (721,616)
Dividends paid (695,274) (667,217) (648,253)
Excess tax bene ts from share-based compensation arrangements 15,454 8,480 4,556
Net cash provided by (used for) nancing activities 3,897,562 (915,858) (874,208)
Effect of exchange rates on cash (81,702) 642 (2,086)
Net increase (decrease) in cash and cash equivalents 4,716,998 761 (276,582)
Cash and cash equivalents at beginning of period 413,046 412,285 688,867
CASH AND CASH EQUIVALENTS AT END OF PERIOD $ 5,130,044 $ 413,046 $ 412,285
Supplemental disclosures of cash ow information:
Cash paid during the period for:
Interest $ 192,939 $ 128,861 $ 131,665
Income taxes 376,508 591,334 620,132
See Notes to Consolidated Financial Statements