Sysco 2015 Annual Report Download - page 23
Download and view the complete annual report
Please find page 23 of the 2015 Sysco annual report below. You can navigate through the pages in the report by either clicking on the pages listed below, or by using the keyword search tool below to find specific information within the annual report.-
 1
1 -
2
-
3
-
4
-
5
-
6
-
7
-
8
-
9
-
10
-
11
-
12
-
 13
13 -
 14
14 -
 15
15 -
 16
16 -
 17
17 -
 18
18 -
 19
19 -
 20
20 -
 21
21 -
 22
22 -
 23
23 -
 24
24 -
 25
25 -
 26
26 -
 27
27 -
 28
28 -
 29
29 -
 30
30 -
 31
31 -
 32
32 -
 33
33 -
34
-
35
-
36
-
37
-
38
-
39
-
40
-
41
-
42
-
43
-
44
-
45
-
46
-
47
-
48
-
49
-
50
-
51
-
52
-
53
-
54
-
55
-
56
-
57
-
58
-
59
-
60
-
61
-
62
-
63
-
64
-
65
-
66
-
67
-
68
-
69
-
70
-
71
-
72
-
73
-
74
-
75
-
76
-
77
-
78
-
79
-
80
-
81
-
82
-
83
-
84
-
85
-
86
-
87
-
88
-
89
-
90
-
91
-
92
-
93
-
94
-
95
-
96
-
97
-
98
-
99
-
100
 |
 |
SYSCO CORPORATION-Form10-K 15
PARTII
ITEM7Management’s Discussion and Analysis ofFinancial Condition and Results of Operations
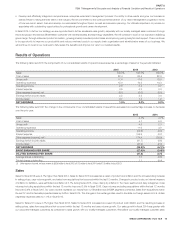
ITEM6 Selected Financial Data
(In thousands except for per share data)
Fiscal Year
2015 2014 2013 2012 2011
Sales $ 48,680,752 $ 46,516,712 $ 44,411,233 $ 42,380,939 $ 39,323,489
Operating income(1) 1,229,362 1,587,122 1,658,478 1,890,632 1,931,502
Earnings before income taxes(1) 1,008,147 1,475,624 1,547,455 1,784,002 1,827,454
Income taxes(1) 321,374 544,091 555,028 662,417 675,424
NET EARNINGS(1) $ 686,773 $ 931,533 $ 992,427 $ 1,121,585 $ 1,152,030
Net earnings:
BASIC EARNINGS PER SHARE(1) $ 1.16 $ 1.59 $ 1.68 $ 1.91 $ 1.96
DILUTED EARNINGS PER SHARE(1) 1.15 1.58 1.67 1.90 1.96
Dividends declared per share $ 1.19 $ 1.15 $ 1.11 $ 1.07 $ 1.03
Total assets $ 17,989,281 $ 13,141,113 $ 12,678,208 $ 12,137,207 $ 11,427,190
Capital expenditures 542,830 523,206 511,862 784,501 636,442
Current maturities of long-term debt(2) $ 4,979,301 $ 304,777 $ 207,301 $ 254,650 $ 207,031
Long-term debt 2,271,825 2,357,330 2,627,544 2,749,304 2,268,204
Total long-term debt 7,251,126 2,662,107 2,834,845 3,003,954 2,475,235
Shareholders’ equity 5,260,224 5,266,695 5,191,810 4,685,040 4,705,242
TOTAL CAPITALIZATION $ 12,511,350 $ 7,928,802 $ 8,026,655 $ 7,688,994 $ 7,180,477
Ratio of long-term debt to capitalization(2) 58.0% 33.6% 35.3% 39.1% 34.5%
(1) Our results of operations are impacted by Certain Items, that have resulted in reduced earnings on a GAAP basis. See “Non-GAAP Reconciliations,” within Management’s Discussion and Analysis
of Financial Condition and Results of Operations, for our results on an adjusted basis that exclude Certain Items.
(2) As discussed in Note 11, “Debt and Other Financing Arrangements,” our current maturities of long-term debt include senior notes issued for the proposed merger with US Foods that were required
to be redeemed due to the termination of the merger agreement. We redeemed these notes in July 2015.
Our nancial results are impacted by accounting changes and the adoption of various accounting standards. See Note 2, “Changes in Accounting” to the
Consolidated Financial Statements in Item 8 for further discussion.
ITEM7 Management’s Discussion and Analysis
ofFinancial Condition and Results of Operations
Our discussion below of our results includes certain non-GAAP nancial measures that we believe provide important perspective with respect to underlying
business trends and results and provides meaningful supplemental information to both management and investors that is indicative of the performance
ofthe company’s underlying operations and facilitates comparison on a year-over-year basis. Other than free cash ow, any non-GAAP nancial measures
will be denoted as adjusted measures and exclude the impact from multiemployer pension withdrawal charges, severance charges, integration planning,
litigation costs and termination costs in connection with the merger that had been proposed with U.S. Foods, Inc. (US Foods), facility closure charges and US
Foods related nancing costs. Additional items in scal 2014 include a change in estimate of self-insurance, and charges from a contingency accrual. These
scal 2015 and 2014 items are collectively referred to as (Certain Items). Our US Foods nancing costs include the write off of unamortized debt issuance
costs when our bridge acquisition facility was terminated upon the issuance of our senior notes in October 2014 and interest expense on those senior
notes. In scal 2014, costs from executive retirement plans restructuring were included within Certain Items; however, because these costs in scal2015
are comparable to scal 2014, these were not included in the Certain Items de nition for the comparison of adjusted results for scal 2015 to scal2014.
This continues to be presented as a Certain Item in the comparison of adjusted results for scal 2014 to scal 2013. More information on the rationale for
the use of these measures and reconciliations to GAAP numbers can be found under “Non-GAAP Reconciliations” and “Liquidity and Capital Resources.”
Overview
Sysco distributes food and related products to restaurants, healthcare and educational facilities, lodging establishments and other foodservice customers.
Our primary operations are located throughout the United States (U.S.), Bahamas, Canada, Costa Rica, Ireland and Mexico and include broadline companies,
SYGMA (our chain restaurant distribution subsidiary), specialty produce companies, custom-cut meat companies, hotel supply operations, a company
that distributes specialty imported products, a company that distributes to international customers and our Sysco Ventures platform, which includes our
suite of technology solutions that help support the business needs of our customers.