Yahoo 2006 Annual Report Download - page 100
Download and view the complete annual report
Please find page 100 of the 2006 Yahoo annual report below. You can navigate through the pages in the report by either clicking on the pages listed below, or by using the keyword search tool below to find specific information within the annual report.-
 1
1 -
2
-
3
-
4
-
5
-
6
-
7
-
8
-
9
-
10
-
11
-
12
-
13
-
14
-
15
-
16
-
17
-
18
-
19
-
20
-
21
-
22
-
23
-
24
-
25
-
26
-
27
-
28
-
29
-
30
-
31
-
32
-
33
-
34
-
35
-
36
-
37
-
38
-
39
-
40
-
41
-
42
-
43
-
44
-
45
-
46
-
47
-
48
-
49
-
50
-
51
-
52
-
53
-
54
-
55
-
56
-
57
-
58
-
59
-
60
-
61
-
62
-
63
-
64
-
65
-
66
-
67
-
68
-
69
-
70
-
71
-
72
-
73
-
74
-
75
-
76
-
77
-
78
-
79
-
80
-
81
-
82
-
83
-
84
-
85
-
86
-
87
-
88
-
89
-
 90
90 -
 91
91 -
 92
92 -
 93
93 -
 94
94 -
 95
95 -
 96
96 -
 97
97 -
 98
98 -
 99
99 -
 100
100 -
 101
101 -
 102
102 -
 103
103 -
 104
104 -
 105
105 -
 106
106 -
 107
107 -
 108
108 -
 109
109 -
 110
110 -
111
-
112
-
113
-
114
-
115
-
116
-
117
-
118
-
119
-
120
-
121
-
122
-
123
-
124
-
125
-
126
 |
 |

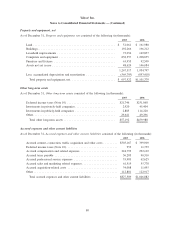
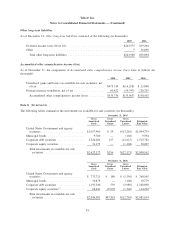
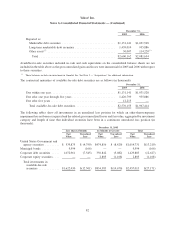
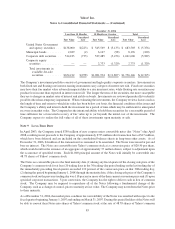
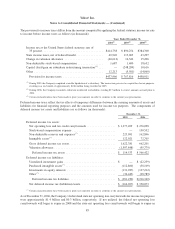
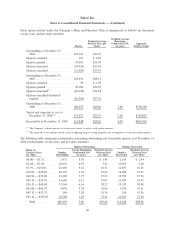
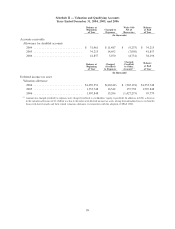
Stock option activity under the Company’s Plans and Directors’ Plan is summarized as follows (in thousands,
except years and per share amounts):
Shares
Weighted Average
Exercise Price per
Share
Weighted Average
Remaining
Contractual Life
(in years)
Aggregate
Intrinsic Value
Outstanding at December 31,
2004 ...................... 212,701 $23.67
Options assumed ............... 193 $ 0.63
Options granted................ 33,403 $36.39
Options exercised .............. (50,920) $13.44
Options cancelled .............. (12,683) $33.93
Outstanding at December 31,
2005 ...................... 182,694 $28.11
Options assumed ............... 39 $ 1.05
Options granted................ 43,386 $29.97
Options exercised
(1)
............. (20,158) $11.82
Options cancelled /forfeited/
expired .................... (16,306) $37.52
Outstanding at December 31,
2006 ...................... 189,655 $29.46 5.66 $730,198
Vested and expected to vest at
December 31, 2006
(2)
......... 179,557 $29.37 5.60 $724,893
Exercisable at December 31, 2006 . . 112,448 $28.26 4.95 $667,919
(1)
The Company’s current practice is to issue new shares to satisfy stock option exercises.
(2)
The expected to vest options are the result of applying the pre-vesting forfeiture rate assumptions to total outstanding options.
The following table summarizes information concerning outstanding and exercisable options as of December 31,
2006 (in thousands, except years and per share amounts):
Range of
Exercise Prices
per Share
Number
Outstanding
Average Remaining
Contractual Life
(in years)
Weighted Average
Exercise Price
per Share
Number
Exercisable
Weighted Average
Exercise Price
per Share
Options Outstanding Options Exercisable
$0.00 — $3.37...... 1,971 3.70 $ 1.44 1,143 $ 2.44
$3.48 — $7.49...... 10,632 4.59 5.41 10,563 5.40
$7.59 — $15.00 ..... 22,696 5.12 10.51 21,897 10.45
$15.02 — $20.85 .... 20,197 6.62 19.92 16,020 19.93
$20.96 — $30.00 .... 33,390 5.75 27.23 15,532 27.76
$30.15 — $35.95 .... 51,690 6.12 33.07 13,907 34.55
$36.13 — $40.68 .... 33,564 6.16 38.22 19,333 38.04
$41.09 — $46.37 .... 4,930 3.78 42.80 3,474 43.11
$47.13 — $52.75 .... 196 3.20 51.36 196 51.36
$53.14 — $292.07 . . . 10,389 3.19 73.51 10,383 73.50
Total ........... 189,655 5.66 $29.46 112,448 $28.26
90
Yahoo! Inc.
Notes to Consolidated Financial Statements — (Continued)