Yahoo 2006 Annual Report Download - page 53
Download and view the complete annual report
Please find page 53 of the 2006 Yahoo annual report below. You can navigate through the pages in the report by either clicking on the pages listed below, or by using the keyword search tool below to find specific information within the annual report.-
 1
1 -
2
-
3
-
4
-
5
-
6
-
7
-
8
-
9
-
10
-
11
-
12
-
13
-
14
-
15
-
16
-
17
-
18
-
19
-
20
-
21
-
22
-
23
-
24
-
25
-
26
-
27
-
28
-
29
-
30
-
31
-
32
-
33
-
34
-
35
-
36
-
37
-
38
-
39
-
40
-
41
-
42
-
 43
43 -
 44
44 -
 45
45 -
 46
46 -
 47
47 -
 48
48 -
 49
49 -
 50
50 -
 51
51 -
 52
52 -
 53
53 -
 54
54 -
 55
55 -
 56
56 -
 57
57 -
 58
58 -
 59
59 -
 60
60 -
 61
61 -
 62
62 -
 63
63 -
64
-
65
-
66
-
67
-
68
-
69
-
70
-
71
-
72
-
73
-
74
-
75
-
76
-
77
-
78
-
79
-
80
-
81
-
82
-
83
-
84
-
85
-
86
-
87
-
88
-
89
-
90
-
91
-
92
-
93
-
94
-
95
-
96
-
97
-
98
-
99
-
100
-
101
-
102
-
103
-
104
-
105
-
106
-
107
-
108
-
109
-
110
-
111
-
112
-
113
-
114
-
115
-
116
-
117
-
118
-
119
-
120
-
121
-
122
-
123
-
124
-
125
-
126
 |
 |

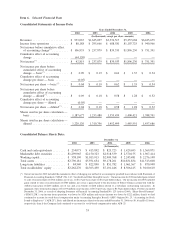
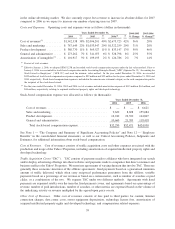
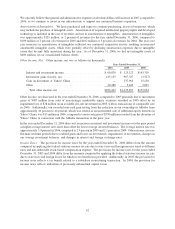
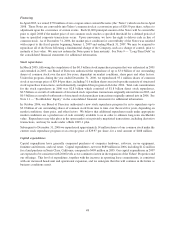
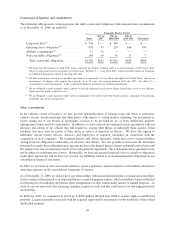
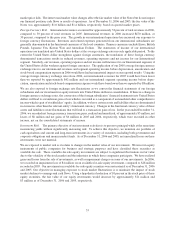
The following table summarizes the differences between our provision for income taxes and the amount computed
by applying the federal statutory income tax rate to income before income taxes (dollars in thousands):
2004
(2)
2005
(2)
2006
(2)
Years Ended December 31,
(1)
Income tax at the United States federal statutory rate of
35 percent .................................. $414,758 35% $ 890,254 35% $384,300 35%
State income taxes, net of federal benefit ............. 49,920 4% 113,685 4% 43,297 4%
Change in valuation allowance ..................... (40,612) (3)% 16,342 1% 15,206 1%
Non-deductible stock-based compensation ............ 1,687 0% 1,400 0% 18,652 2%
Capital (loss)/gain on subsidiary restructuring
transaction .................................. — — (248,284) (10)% 10,616 1%
Other ........................................ 12,213 1% (5,581) 0% (14,060) (1)%
Provision for income taxes ...................... $437,966 37% $ 767,816 30% $458,011 42%
(1)
Certain reclassifications have been made to prior year amounts in order to conform to the current year presentation.
(2)
Percent of income before income taxes, earnings in equity interests and minority interests.
Our effective tax rate for the year ended December 31, 2006 was 42 percent, compared to 30 percent in the prior
year. The higher effective tax rate in 2006 was mainly attributable to the impact of a global reorganization intended
to streamline our operational structure and the non-deductible portion of stock-based compensation expense
resulting from the adoption of SFAS 123R. These impacts were offset by a reduction in deferred tax liabilities
totaling $17 million that we recorded to correct amounts accrued in years prior to 2004. Our effective tax rate for the
year ended December 31, 2005 was 30 percent compared to 37 percent in 2004. The decreased rate was mainly
attributable to the tax benefit related to a subsidiary restructuring transaction. In 2005, as part of our ongoing efforts
to streamline our operational structure, we completed a taxable liquidation of a subsidiary we acquired several years
ago. This transaction gave rise to a capital loss for tax purposes, which offset a substantial portion of the gains from
sales of equity investments during the year. The resulting tax benefit recorded in 2005 was approximately
$248 million.
Based on current estimates, we expect our effective tax rate will increase in 2007 compared to 2006.
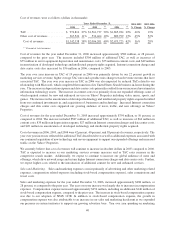
Earnings in Equity Interests. Earnings in equity interests was approximately $112 million for the year ended
December 31, 2006, which consisted of our share of the net income or loss of our equity investments in Yahoo!
Japan and Alibaba. During the first quarter of 2006, we started recording, one quarter in arrears, our share of the
results of Alibaba and the related amortization expense of the acquired intangible assets. Earnings in equity
interests for the years ended December 31, 2005 and 2004 were $128 million and $95 million, respectively, as a
result of our investment in Yahoo! Japan. See Note 4 — “Investments in Equity Interests” in the consolidated
financial statements for additional information.
Minority Interests in Operations of Consolidated Subsidiaries. Minority interests in operations of consolidated
subsidiaries represents the minority holders’ percentage share of income or losses from the subsidiaries in which we
hold a majority, but less than 100 percent, ownership interest and consolidate the subsidiaries’ results in our
financial statements. Minority interests in operations of consolidated subsidiaries was approximately $1 million in
2006, compared to $8 million in 2005 and $2 million in 2004. Minority interests recorded in 2006 were related to
our strategic partnership with Seven Network Limited (“Yahoo! 7”). Minority interests recorded in 2005 and 2004
were related to our joint ventures in France, Germany and the United Kingdom (collectively “Yahoo! Europe”) and
Yahoo! Korea. In 2005, we purchased the remaining outstanding shares of Yahoo! Europe and Yahoo! Korea from
our partner in these ventures, and accordingly, these entities became our wholly owned subsidiaries. See Note 3 —
“Acquisitions” in the consolidated financial statements for additional information.
Business Segment Results
We manage our business geographically. Our primary areas of measurement and decision-making are the United
States and International. Management relies on an internal management reporting process that provides revenue
43