Yahoo 2006 Annual Report Download - page 54
Download and view the complete annual report
Please find page 54 of the 2006 Yahoo annual report below. You can navigate through the pages in the report by either clicking on the pages listed below, or by using the keyword search tool below to find specific information within the annual report.-
 1
1 -
2
-
3
-
4
-
5
-
6
-
7
-
8
-
9
-
10
-
11
-
12
-
13
-
14
-
15
-
16
-
17
-
18
-
19
-
20
-
21
-
22
-
23
-
24
-
25
-
26
-
27
-
28
-
29
-
30
-
31
-
32
-
33
-
34
-
35
-
36
-
37
-
38
-
39
-
40
-
41
-
42
-
43
-
 44
44 -
 45
45 -
 46
46 -
 47
47 -
 48
48 -
 49
49 -
 50
50 -
 51
51 -
 52
52 -
 53
53 -
 54
54 -
 55
55 -
 56
56 -
 57
57 -
 58
58 -
 59
59 -
 60
60 -
 61
61 -
 62
62 -
 63
63 -
 64
64 -
65
-
66
-
67
-
68
-
69
-
70
-
71
-
72
-
73
-
74
-
75
-
76
-
77
-
78
-
79
-
80
-
81
-
82
-
83
-
84
-
85
-
86
-
87
-
88
-
89
-
90
-
91
-
92
-
93
-
94
-
95
-
96
-
97
-
98
-
99
-
100
-
101
-
102
-
103
-
104
-
105
-
106
-
107
-
108
-
109
-
110
-
111
-
112
-
113
-
114
-
115
-
116
-
117
-
118
-
119
-
120
-
121
-
122
-
123
-
124
-
125
-
126
 |
 |

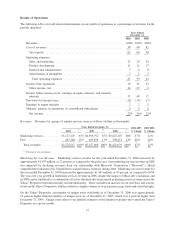
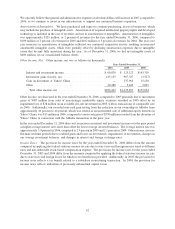
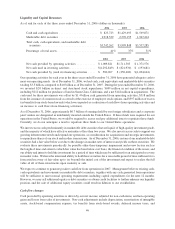
and segment operating income before depreciation, amortization and stock-based compensation expense for
making financial decisions and allocating resources. Segment operating income before depreciation, amortization
and stock-based compensation expense, includes income from operations before depreciation, amortization and
stock-based compensation expense. Management believes that segment operating income before depreciation,
amortization and stock-based compensation expense is an appropriate measure for evaluating the operational
performance of our segments. However, this measure should be considered in addition to, not as a substitute for, or
superior to, income from operations or other measures of financial performance prepared in accordance with
generally accepted accounting principles in the United States (“GAAP”).
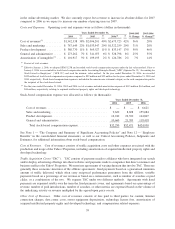
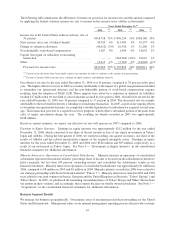
Summarized information by segment was as follows (dollars in thousands):
2004
(*)
2005
(*)
2006
(*)
2004-2005
% Change
2005-2006
% Change
Years Ended December 31,
Revenues by
segment:
United States . . . . $2,653,437 74% $3,667,509 70% $4,365,922 68% 38% 19%
International . . . . . 921,080 26% 1,590,159 30% 2,059,757 32% 73% 30%
Total revenues . . $3,574,517 100% $5,257,668 100% $6,425,679 100% 47% 22%
(*)
Percent of total revenues.
2004 2005 2006
2004-2005
% Change
2005-2006
% Change
Years Ended December 31,
Segment operating income before
depreciation, amortization and stock-
based compensation expense:
United States . . . . . . . . . . . . . . . . . . . . $ 891,103 $1,219,539 $1,451,656 37% 19%
International . . . . . . . . . . . . . . . . . . . . 140,809 337,799 454,261 140% 34%
Total segment operating income before
depreciation, amortization and
stock-based compensation
expense: . . . . . . . . . . . . . . . . . . . . 1,031,912 1,557,338 1,905,917 51% 22%
Depreciation and amortization . . . . . . . . (311,041) (397,142) (540,021) 28% 36%
Stock-based compensation expense. . . . . (32,290) (52,471) (424,930) 62% N/A%
Income from operations . . . . . . . . . . . $ 688,581 $1,107,725 $ 940,966 61% (15)%
Revenue is attributed to individual countries according to the international online property that generated the
revenue. No single foreign country accounted for more than 10 percent of revenues in 2006, 2005, or 2004.
United States. United States revenues for the year ended December 31, 2006 increased approximately $698 mil-
lion, or 19 percent, as compared to the prior year. United States revenues for the year ended December 31, 2005
increased approximately $1,014 million, or 38 percent, as compared to 2004. The year over year increases in 2006
and 2005 were a result of growth in advertising across the Yahoo! Properties, as well as growth from our fee-based
services. Approximately 82 percent of the 2006 increase, or $570 million, came from marketing services revenue.
Approximately 82 percent of the 2005 increase, or $827 million, came from marketing services revenue. The
advertising growth can be attributed to our expanding audience of users and increased inventory of our page views
which has attracted more advertisers and led to increases in our marketing services revenue. The growth in our fee-
based services is due to the increase in our paying users for both existing and new offerings.
International. International revenues for the year ended December 31, 2006 increased approximately $470 mil-
lion, or 30 percent, as compared to the prior year. International revenues for the year ended December 31, 2005
increased approximately $669 million, or 73 percent, as compared to 2004. More than 95 percent of the
international revenue increases in 2006 and 2005 came from marketing services revenue. The year over year
growth in international marketing services revenue can be attributed to our increased penetration into existing
markets, coupled with continued growth of the global online advertising marketplace and our affiliate network.
44