Yahoo 2006 Annual Report Download - page 45
Download and view the complete annual report
Please find page 45 of the 2006 Yahoo annual report below. You can navigate through the pages in the report by either clicking on the pages listed below, or by using the keyword search tool below to find specific information within the annual report.-
 1
1 -
2
-
3
-
4
-
5
-
6
-
7
-
8
-
9
-
10
-
11
-
12
-
13
-
14
-
15
-
16
-
17
-
18
-
19
-
20
-
21
-
22
-
23
-
24
-
25
-
26
-
27
-
28
-
29
-
30
-
31
-
32
-
33
-
34
-
 35
35 -
 36
36 -
 37
37 -
 38
38 -
 39
39 -
 40
40 -
 41
41 -
 42
42 -
 43
43 -
 44
44 -
 45
45 -
 46
46 -
 47
47 -
 48
48 -
 49
49 -
 50
50 -
 51
51 -
 52
52 -
 53
53 -
 54
54 -
 55
55 -
56
-
57
-
58
-
59
-
60
-
61
-
62
-
63
-
64
-
65
-
66
-
67
-
68
-
69
-
70
-
71
-
72
-
73
-
74
-
75
-
76
-
77
-
78
-
79
-
80
-
81
-
82
-
83
-
84
-
85
-
86
-
87
-
88
-
89
-
90
-
91
-
92
-
93
-
94
-
95
-
96
-
97
-
98
-
99
-
100
-
101
-
102
-
103
-
104
-
105
-
106
-
107
-
108
-
109
-
110
-
111
-
112
-
113
-
114
-
115
-
116
-
117
-
118
-
119
-
120
-
121
-
122
-
123
-
124
-
125
-
126
 |
 |

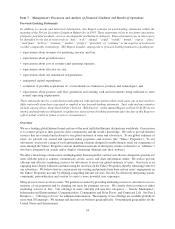
Revenue Sources
Marketing Services Revenue. The majority of our marketing services revenue is from sales of online display
advertising and is generated from several offerings including: the display of rich media advertisements, display of
text based links to an advertiser’s website, listing based services, and commerce based transactions.
We recognize revenue from the display of graphical advertisements (“display advertising”) on the Yahoo!
Properties and on the websites of our affiliates as “impressions” are delivered. An “impression” is delivered
when an advertisement appears in pages viewed by users. We also recognize revenue from the display of text based
links to the websites of our advertisers (“search advertising”) which are placed on the Yahoo! Properties and also on
the websites of our affiliates who have integrated our search offerings into their websites. We recognize revenue
from these arrangements as “click-throughs” occur. A “click-through” occurs when a user clicks on an advertiser’s
listing.
Marketing services revenue also includes listings revenue and transaction revenue. Listings revenue is generated
from a variety of consumer and business listings-based services, including access to the Yahoo! HotJobs database
and classifieds such as Yahoo! Autos, Yahoo! Real Estate and other services. We recognize listings revenue when
the services are performed. Transaction revenue is generated from facilitating commercial transactions through the
Yahoo! Properties, principally from Yahoo! Travel and Yahoo! Shopping. We recognize transaction revenue when
there is evidence that qualifying transactions have occurred, for example, when travel arrangements are booked
through Yahoo! Travel.
Fees Revenue. Fees revenue consists of revenues generated from a variety of consumer and business fee-based
services, including Internet broadband services, premium mail, music and personals offerings, as well as services
for small businesses. We recognize fees revenue when the services are performed.
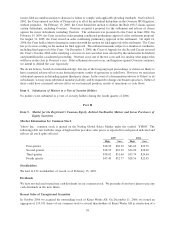
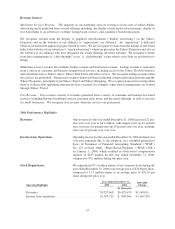
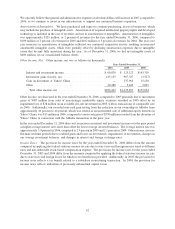
2006 Performance Highlights
Revenues Our revenues for the year ended December 31, 2006 increased 22 per-
cent year over year to $6.4 billion, with unique users up 16 percent
year over year, fee paying users up 29 percent year over year, and page
views up 22 percent year over year.
Income from Operations Operating income for the year ended December 31, 2006 declined year
over year primarily due to the adoption, on a modified prospective
basis, of Statement of Financial Accounting Standards (“SFAS”)
No. 123 (revised 2004), “Share-Based Payment” (“SFAS 123R”)
on January 1, 2006, which resulted in stock-based compensation
expense of $425 million for the year ended December 31, 2006,
compared to $52 million during the prior year.
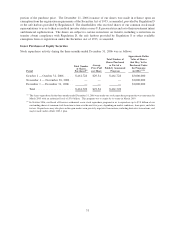
Stock Repurchases We repurchased 93.1 million shares of our common stock during the
year ended December 31, 2006 at an average price of $29.84 per share,
compared to 11.7 million shares at an average price of $33.20 per
share during the prior year.
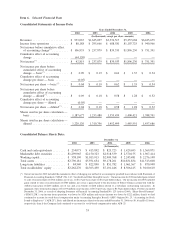
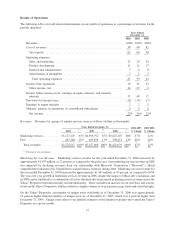
Operating Highlights 2005 2006
2005-2006
Change
Years Ended December 31,
(In thousands)
Revenues ..................................... $5,257,668 $6,425,679 $1,168,011
Income from operations .......................... $1,107,725 $ 940,966 $ (166,759)
35