Yahoo 2006 Annual Report Download - page 71
Download and view the complete annual report
Please find page 71 of the 2006 Yahoo annual report below. You can navigate through the pages in the report by either clicking on the pages listed below, or by using the keyword search tool below to find specific information within the annual report.-
 1
1 -
2
-
3
-
4
-
5
-
6
-
7
-
8
-
9
-
10
-
11
-
12
-
13
-
14
-
15
-
16
-
17
-
18
-
19
-
20
-
21
-
22
-
23
-
24
-
25
-
26
-
27
-
28
-
29
-
30
-
31
-
32
-
33
-
34
-
35
-
36
-
37
-
38
-
39
-
40
-
41
-
42
-
43
-
44
-
45
-
46
-
47
-
48
-
49
-
50
-
51
-
52
-
53
-
54
-
55
-
56
-
57
-
58
-
59
-
60
-
 61
61 -
 62
62 -
 63
63 -
 64
64 -
 65
65 -
 66
66 -
 67
67 -
 68
68 -
 69
69 -
 70
70 -
 71
71 -
 72
72 -
 73
73 -
 74
74 -
 75
75 -
 76
76 -
 77
77 -
 78
78 -
 79
79 -
 80
80 -
 81
81 -
82
-
83
-
84
-
85
-
86
-
87
-
88
-
89
-
90
-
91
-
92
-
93
-
94
-
95
-
96
-
97
-
98
-
99
-
100
-
101
-
102
-
103
-
104
-
105
-
106
-
107
-
108
-
109
-
110
-
111
-
112
-
113
-
114
-
115
-
116
-
117
-
118
-
119
-
120
-
121
-
122
-
123
-
124
-
125
-
126
 |
 |

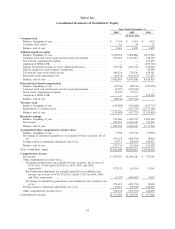
Yahoo! Inc.
Consolidated Statements of Stockholders’ Equity
2004 2005 2006
Years Ended December 31,
(In thousands)
Common stock
Balance, beginning of year . . . . . . . . . . . . . . . . . . . . . . . . . . . . . . . . . . . . $ 1,354 $ 1,416 $ 1,470
Common stock issued . . . . . . . . . . . . . . . . . . . . . . . . . . . . . . . . . . . . . . . 62 54 23
Balance, end of year . . . . . . . . . . . . . . . . . . . . . . . . . . . . . . . . . . . . . . . . 1,416 1,470 1,493
Additional paid-in capital
Balance, beginning of year . . . . . . . . . . . . . . . . . . . . . . . . . . . . . . . . . . . . 4,340,514 5,682,884 6,417,858
Common stock and stock-based awards issued and assumed. . . . . . . . . . . . . 667,212 1,010,012 318,160
Stock-based compensation expense . . . . . . . . . . . . . . . . . . . . . . . . . . . . . . — — 451,467
Adoption of SFAS 123R . . . . . . . . . . . . . . . . . . . . . . . . . . . . . . . . . . . . . — — (235,394)
Change in deferred income tax asset valuation allowance. . . . . . . . . . . . . . . 335,740 (423,147) 236,044
Gain in connection with business contribution . . . . . . . . . . . . . . . . . . . . . . — — 29,944
Tax benefits from stock-based awards . . . . . . . . . . . . . . . . . . . . . . . . . . . . 408,976 759,530 630,541
Structured stock repurchases, net . . . . . . . . . . . . . . . . . . . . . . . . . . . . . . . (69,558) (611,421) 767,295
Balance, end of year . . . . . . . . . . . . . . . . . . . . . . . . . . . . . . . . . . . . . . . . 5,682,884 6,417,858 8,615,915
Deferred stock-based compensation
Balance, beginning of year . . . . . . . . . . . . . . . . . . . . . . . . . . . . . . . . . . . . (52,374) (28,541) (235,394)
Common stock and stock-based awards issued and assumed. . . . . . . . . . . . . (8,457) (259,324) —
Stock-based compensation expense . . . . . . . . . . . . . . . . . . . . . . . . . . . . . . 32,290 52,471 —
Adoption of SFAS 123R . . . . . . . . . . . . . . . . . . . . . . . . . . . . . . . . . . . . . — — 235,394
Balance, end of year . . . . . . . . . . . . . . . . . . . . . . . . . . . . . . . . . . . . . . . . (28,541) (235,394) —
Treasury stock
Balance, beginning of year . . . . . . . . . . . . . . . . . . . . . . . . . . . . . . . . . . . . (159,988) (159,988) (547,723)
Repurchases of common stock . . . . . . . . . . . . . . . . . . . . . . . . . . . . . . . . . — (387,735) (2,777,140)
Balance, end of year . . . . . . . . . . . . . . . . . . . . . . . . . . . . . . . . . . . . . . . . (159,988) (547,723) (3,324,863)
Retained earnings
Balance, beginning of year . . . . . . . . . . . . . . . . . . . . . . . . . . . . . . . . . . . . 230,386 1,069,939 2,966,169
Net income . . . . . . . . . . . . . . . . . . . . . . . . . . . . . . . . . . . . . . . . . . . . . . 839,553 1,896,230 751,391
Balance, end of year . . . . . . . . . . . . . . . . . . . . . . . . . . . . . . . . . . . . . . . . 1,069,939 2,966,169 3,717,560
Accumulated other comprehensive income (loss)
Balance, beginning of year . . . . . . . . . . . . . . . . . . . . . . . . . . . . . . . . . . . . 3,598 535,736 (35,965)
Net change in unrealized gains/losses on available-for-sale securities, net of
tax . . . . . . . . . . . . . . . . . . . . . . . . . . . . . . . . . . . . . . . . . . . . . . . . . . . 471,425 (491,532) 38,018
Foreign currency translation adjustment, net of tax . . . . . . . . . . . . . . . . . . . 60,713 (80,169) 148,452
Balance, end of year . . . . . . . . . . . . . . . . . . . . . . . . . . . . . . . . . . . . . . . . 535,736 (35,965) 150,505
Total stockholders’ equity . . . . . . . . . . . . . . . . . . . . . . . . . . . . . . . . . . . . . . $7,101,446 $8,566,415 $ 9,160,610
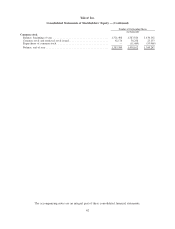
Comprehensive income
Net income . . . . . . . . . . . . . . . . . . . . . . . . . . . . . . . . . . . . . . . . . . . . . . $ 839,553 $1,896,230 $ 751,391
Other comprehensive income (loss):
Unrealized gains/(losses) on available-for-sale securities, net of taxes of
$(315,001), $7,669 and $(29,914) for 2004, 2005, and 2006,
respectively . . . . . . . . . . . . . . . . . . . . . . . . . . . . . . . . . . . . . . . . . . . 472,532 (11,510) 32,961
Reclassification adjustment for realized (gains)/losses included in net
income, net of taxes of $738, $320,015, and $(3,371) for 2004, 2005,
and 2006, respectively. . . . . . . . . . . . . . . . . . . . . . . . . . . . . . . . . . . . (1,107) (480,022) 5,057
Net change in unrealized (gains)/losses on available-for-sale securities, net
of tax . . . . . . . . . . . . . . . . . . . . . . . . . . . . . . . . . . . . . . . . . . . . . . . 471,425 (491,532) 38,018
Foreign currency translation adjustment, net of tax . . . . . . . . . . . . . . . . . . . 60,713 (80,169) 148,452
Other comprehensive income (loss) . . . . . . . . . . . . . . . . . . . . . . . . . . . . . . 532,138 (571,701) 186,470
Comprehensive income . . . . . . . . . . . . . . . . . . . . . . . . . . . . . . . . . . . . . . . . $1,371,691 $1,324,529 $ 937,861
61