Yahoo 2006 Annual Report Download - page 51
Download and view the complete annual report
Please find page 51 of the 2006 Yahoo annual report below. You can navigate through the pages in the report by either clicking on the pages listed below, or by using the keyword search tool below to find specific information within the annual report.-
 1
1 -
2
-
3
-
4
-
5
-
6
-
7
-
8
-
9
-
10
-
11
-
12
-
13
-
14
-
15
-
16
-
17
-
18
-
19
-
20
-
21
-
22
-
23
-
24
-
25
-
26
-
27
-
28
-
29
-
30
-
31
-
32
-
33
-
34
-
35
-
36
-
37
-
38
-
39
-
40
-
 41
41 -
 42
42 -
 43
43 -
 44
44 -
 45
45 -
 46
46 -
 47
47 -
 48
48 -
 49
49 -
 50
50 -
 51
51 -
 52
52 -
 53
53 -
 54
54 -
 55
55 -
 56
56 -
 57
57 -
 58
58 -
 59
59 -
 60
60 -
 61
61 -
62
-
63
-
64
-
65
-
66
-
67
-
68
-
69
-
70
-
71
-
72
-
73
-
74
-
75
-
76
-
77
-
78
-
79
-
80
-
81
-
82
-
83
-
84
-
85
-
86
-
87
-
88
-
89
-
90
-
91
-
92
-
93
-
94
-
95
-
96
-
97
-
98
-
99
-
100
-
101
-
102
-
103
-
104
-
105
-
106
-
107
-
108
-
109
-
110
-
111
-
112
-
113
-
114
-
115
-
116
-
117
-
118
-
119
-
120
-
121
-
122
-
123
-
124
-
125
-
126
 |
 |
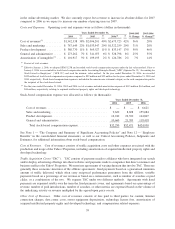
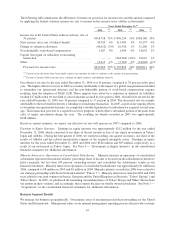
increased by $25 million for the year ended December 31, 2006, reflecting our continued investment in our product
branding and development of our distribution channels.
Sales and marketing expenses for the year ended December 31, 2005, increased approximately $246 million, or
31 percent, as compared to the prior year. Approximately $141 million of the increase was related to compensation
expense as we increased our sales and marketing headcount to expand our presence in certain territories.
Additionally, year over year spending on marketing and distribution increased by $56 million, as we continued
to invest in product branding and further develop our distribution channels.
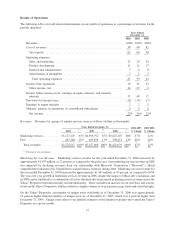
Sales and marketing expenses as a percentage of revenue in 2006 was 20 percent (including 2 percent related to
stock-based compensation expense), compared to 20 percent and 22 percent in 2005 and 2004, respectively.
We currently believe that sales and marketing expenses will increase in absolute dollars in 2007 compared to 2006,
as we continue to grow and expand our reach to advertisers and users.
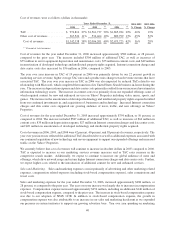
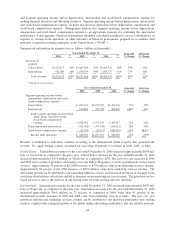
Product Development. Product development expenses consist primarily of compensation related expenses
(including stock-based compensation expense) incurred for the development of, enhancements to and maintenance
of the Yahoo! Properties, classification and organization of listings within Yahoo! Properties, research and
development, and Yahoo!’s technology platforms and infrastructure. Depreciation expense and other operating
costs are also included in product development.
Product development expenses for the year ended December 31, 2006 increased $264 million, or 46 percent, as
compared to the prior year. Product development compensation expense increased by approximately $248 million
compared to the prior year, of which $122 million was additional stock-based compensation expense due to our
adoption of SFAS 123R. In addition to stock-based compensation expense, the increased compensation expenses
also reflect our continued hiring of engineering talent to further develop and enhance new and existing offerings and
services on the Yahoo! Properties.
Product development expenses for the year ended December 31, 2005 increased approximately $189 million, or
50 percent, as compared to the year ended December 31, 2004. Approximately $131 million related to increased
compensation expense as we continued to hire engineers to further develop and create new offerings and services on
the Yahoo! Properties. Additionally, approximately $22 million of the increase related to higher depreciation
expense arising from our additional investments in property and equipment to support further product development,
and $23 million related to the increase in supplies and equipment related expenses required to support our growing
headcount.
Product development expenses as a percentage of revenue in 2006 was 13 percent (including 2 percent related to
stock-based compensation expense), compared to 11 percent in both 2005 and 2004.
We currently believe that product development expenses will increase in absolute dollars in 2007 compared to 2006,
as we believe that continued investments in product development are required to remain competitive.
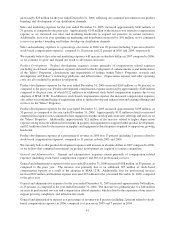
General and Administrative. General and administrative expenses consist primarily of compensation related
expenses (including stock-based compensation expense) and fees for professional services.
General and administrative expense for the year ended December 31, 2006 increased $188 million, or 55 percent, as
compared to the prior year. The increase was primarily due to an additional $97 million of stock-based
compensation expense as a result of the adoption of SFAS 123R. Additionally, fees for professional services
increased $32 million and facilities expense increased $25 million for the year ended December 31, 2006, compared
to the prior year.
General and administrative expenses for the year ended December 31, 2005 increased approximately $68 million,
or 25 percent, as compared to the year ended December 31, 2004. The increase was primarily due to a $48 million
increase in professional services and compensation related expenses, which related to the expansion of our team to
support growing compliance and infrastructure needs.
General and administrative expense as a percentage of revenue was 8 percent (including 2 percent related to stock-
based compensation expense) in 2006, compared to 6 percent in 2005 and 7 percent in 2004.
41