Yahoo 2006 Annual Report Download - page 46
Download and view the complete annual report
Please find page 46 of the 2006 Yahoo annual report below. You can navigate through the pages in the report by either clicking on the pages listed below, or by using the keyword search tool below to find specific information within the annual report.-
 1
1 -
2
-
3
-
4
-
5
-
6
-
7
-
8
-
9
-
10
-
11
-
12
-
13
-
14
-
15
-
16
-
17
-
18
-
19
-
20
-
21
-
22
-
23
-
24
-
25
-
26
-
27
-
28
-
29
-
30
-
31
-
32
-
33
-
34
-
35
-
 36
36 -
 37
37 -
 38
38 -
 39
39 -
 40
40 -
 41
41 -
 42
42 -
 43
43 -
 44
44 -
 45
45 -
 46
46 -
 47
47 -
 48
48 -
 49
49 -
 50
50 -
 51
51 -
 52
52 -
 53
53 -
 54
54 -
 55
55 -
 56
56 -
57
-
58
-
59
-
60
-
61
-
62
-
63
-
64
-
65
-
66
-
67
-
68
-
69
-
70
-
71
-
72
-
73
-
74
-
75
-
76
-
77
-
78
-
79
-
80
-
81
-
82
-
83
-
84
-
85
-
86
-
87
-
88
-
89
-
90
-
91
-
92
-
93
-
94
-
95
-
96
-
97
-
98
-
99
-
100
-
101
-
102
-
103
-
104
-
105
-
106
-
107
-
108
-
109
-
110
-
111
-
112
-
113
-
114
-
115
-
116
-
117
-
118
-
119
-
120
-
121
-
122
-
123
-
124
-
125
-
126
 |
 |

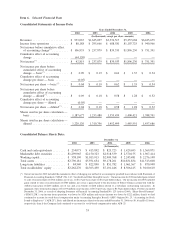
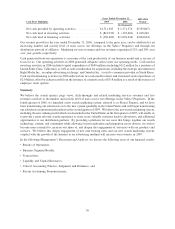
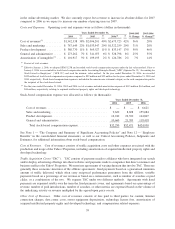
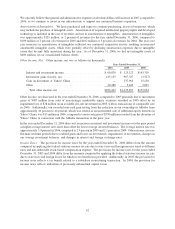
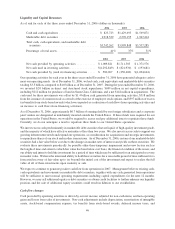
Cash Flow Highlights 2005 2006
2005-2006
Change
Years Ended December 31,
(In thousands)
Net cash provided by operating activities ............. $1,711,383 $ 1,371,576 $(339,807)
Net cash used in investing activities ................. $ (821,930) $ (193,681) $ 628,249
Net cash used in financing activities ................. $ (250,600) $(1,094,624) $(844,024)
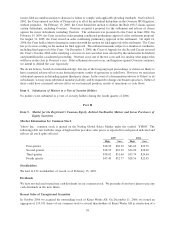
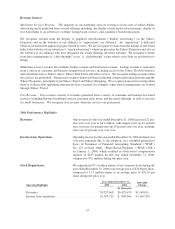
Our revenue growth for the year ended December 31, 2006, compared to the prior year, can be attributed to an
increasing number and activity level of users across our offerings on the Yahoo! Properties and through our
distribution network of affiliates. Marketing services revenues and fees revenues experienced 22% and 20% year
over year growth, respectively.
Cash generated from our operations is a measure of the cash productivity of our business model and is an area of
focus for us. Our operating activities in 2006 generated adequate cash to meet our operating needs. Cash used in
investing activities in 2006 included capital expenditures of $689 million (including $112 million for a purchase of
land in Santa Clara, California), as well as cash consideration for acquisitions, including the strategic investments in
Right Media Inc., an online advertising exchange, and Gmarket Inc., a retail e-commerce provider in South Korea.
Cash used in financing activities in 2006 reflected our net cash used for direct and structured stock repurchases of
$2.0 billion, offset by cash proceeds from the issuance of common stock of $318 million as a result of the exercise of
employee stock options.
Summary
We believe the search queries, page views, click-throughs and related marketing services revenues and fees
revenues correlate to the number and activity level of users across our offerings on the Yahoo! Properties. In the
fourth quarter of 2006, we launched a new search marketing system, referred to as Project Panama, and we have
been transitioning our advertisers on to the new system gradually in the United States and will begin transitioning
our advertisers in international markets in the second quarter of 2007. We believe the new search marketing system,
including the new ranking model which was launched in the United States in the first quarter of 2007, will enable us
to provide a more relevant search experience to users, more valuable customer leads to advertisers, and additional
opportunities to our distribution partners. By providing a platform for our users that brings together our search
technology, content, and community while allowing for personalization and integration across devices, we seek to
become more essential to, increase our share of, and deepen the engagement of, our users with our products and
services. We believe this deeper engagement of new and existing users and our new search marketing system,
coupled with the growth of the Internet as an advertising medium will increase our revenues in 2007.
In the following Management’s Discussion and Analysis, we discuss the following areas of our financial results:
• Results of Operations;
• Business Segment Results;
• Transactions;
• Liquidity and Capital Resources;
• Critical Accounting Policies, Judgments and Estimates; and
• Recent Accounting Pronouncements.
36