Yahoo 2006 Annual Report Download - page 69
Download and view the complete annual report
Please find page 69 of the 2006 Yahoo annual report below. You can navigate through the pages in the report by either clicking on the pages listed below, or by using the keyword search tool below to find specific information within the annual report.-
 1
1 -
2
-
3
-
4
-
5
-
6
-
7
-
8
-
9
-
10
-
11
-
12
-
13
-
14
-
15
-
16
-
17
-
18
-
19
-
20
-
21
-
22
-
23
-
24
-
25
-
26
-
27
-
28
-
29
-
30
-
31
-
32
-
33
-
34
-
35
-
36
-
37
-
38
-
39
-
40
-
41
-
42
-
43
-
44
-
45
-
46
-
47
-
48
-
49
-
50
-
51
-
52
-
53
-
54
-
55
-
56
-
57
-
58
-
 59
59 -
 60
60 -
 61
61 -
 62
62 -
 63
63 -
 64
64 -
 65
65 -
 66
66 -
 67
67 -
 68
68 -
 69
69 -
 70
70 -
 71
71 -
 72
72 -
 73
73 -
 74
74 -
 75
75 -
 76
76 -
 77
77 -
 78
78 -
 79
79 -
80
-
81
-
82
-
83
-
84
-
85
-
86
-
87
-
88
-
89
-
90
-
91
-
92
-
93
-
94
-
95
-
96
-
97
-
98
-
99
-
100
-
101
-
102
-
103
-
104
-
105
-
106
-
107
-
108
-
109
-
110
-
111
-
112
-
113
-
114
-
115
-
116
-
117
-
118
-
119
-
120
-
121
-
122
-
123
-
124
-
125
-
126
 |
 |

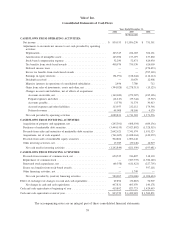
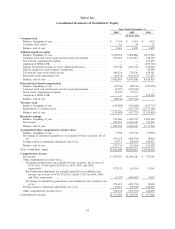
Yahoo! Inc.
Consolidated Statements of Cash Flows
2004 2005 2006
Years Ended December 31,
(In thousands)
CASH FLOWS FROM OPERATING ACTIVITIES:
Net income . . . . . . . . . . . . . . . . . . . . . . . . . . . . . . . . . . . . . . . . . . . . . $ 839,553 $ 1,896,230 $ 751,391
Adjustments to reconcile net income to net cash provided by operating
activities:
Depreciation . . . . . . . . . . . . . . . . . . . . . . . . . . . . . . . . . . . . . . . . . . . 165,345 224,065 302,161
Amortization of intangible assets. . . . . . . . . . . . . . . . . . . . . . . . . . . . . 145,696 173,077 237,860
Stock-based compensation expense . . . . . . . . . . . . . . . . . . . . . . . . . . . 32,290 52,471 424,930
Tax benefits from stock-based awards . . . . . . . . . . . . . . . . . . . . . . . . . 408,976 759,530 626,009
Deferred income taxes . . . . . . . . . . . . . . . . . . . . . . . . . . . . . . . . . . . . — — (274,433)
Excess tax benefits from stock-based awards . . . . . . . . . . . . . . . . . . . . — — (597,118)
Earnings in equity interests. . . . . . . . . . . . . . . . . . . . . . . . . . . . . . . . . (94,991) (128,244) (112,114)
Dividends received . . . . . . . . . . . . . . . . . . . . . . . . . . . . . . . . . . . . . . — 10,670 12,908
Minority interests in operations of consolidated subsidiaries . . . . . . . . . . 2,496 7,780 712
Gains from sales of investments, assets and other, net . . . . . . . . . . . . . . (394,028) (1,278,311) (15,125)
Changes in assets and liabilities, net of effects of acquisitions:
Accounts receivable, net . . . . . . . . . . . . . . . . . . . . . . . . . . . . . . . . . (162,690) (272,387) (185,196)
Prepaid expenses and other . . . . . . . . . . . . . . . . . . . . . . . . . . . . . . . (12,217) (35,344) (9,567)
Accounts payable. . . . . . . . . . . . . . . . . . . . . . . . . . . . . . . . . . . . . . (3,570) 31,574 30,413
Accrued expenses and other liabilities . . . . . . . . . . . . . . . . . . . . . . . 113,953 212,112 174,566
Deferred revenue . . . . . . . . . . . . . . . . . . . . . . . . . . . . . . . . . . . . . . 49,008 58,160 4,179
Net cash provided by operating activities . . . . . . . . . . . . . . . . . . . . . . . 1,089,821 1,711,383 1,371,576
CASH FLOWS FROM INVESTING ACTIVITIES:
Acquisition of property and equipment, net . . . . . . . . . . . . . . . . . . . . . . . (245,501) (408,934) (689,136)
Purchases of marketable debt securities . . . . . . . . . . . . . . . . . . . . . . . . . . (3,449,155) (7,023,802) (1,328,515)
Proceeds from sales and maturities of marketable debt securities . . . . . . . . 2,642,621 7,341,974 1,951,323
Acquisitions, net of cash acquired. . . . . . . . . . . . . . . . . . . . . . . . . . . . . . (761,605) (1,698,164) (142,272)
Proceeds from sales of marketable equity securities . . . . . . . . . . . . . . . . . 502,806 1,006,142 —
Other investing activities, net . . . . . . . . . . . . . . . . . . . . . . . . . . . . . . . . . 17,985 (39,146) 14,919
Net cash used in investing activities . . . . . . . . . . . . . . . . . . . . . . . . . . (1,292,849) (821,930) (193,681)
CASH FLOWS FROM FINANCING ACTIVITIES:
Proceeds from issuance of common stock, net . . . . . . . . . . . . . . . . . . . . . 650,525 746,807 318,103
Repurchases of common stock . . . . . . . . . . . . . . . . . . . . . . . . . . . . . . . . — (387,735) (1,782,140)
Structured stock repurchases, net . . . . . . . . . . . . . . . . . . . . . . . . . . . . . . (69,558) (611,421) (227,705)
Excess tax benefits from stock-based awards . . . . . . . . . . . . . . . . . . . . . . — — 597,118
Other financing activities, net . . . . . . . . . . . . . . . . . . . . . . . . . . . . . . . . . — 1,749 —
Net cash provided by (used in) financing activities . . . . . . . . . . . . . . . . 580,967 (250,600) (1,094,624)
Effect of exchange rate changes on cash and cash equivalents . . . . . . . . . . . . 29,892 (32,883) 56,907
Net change in cash and cash equivalents . . . . . . . . . . . . . . . . . . . . . . . 407,831 605,970 140,178
Cash and cash equivalents at beginning of year . . . . . . . . . . . . . . . . . . . . . . 415,892 823,723 1,429,693
Cash and cash equivalents at end of year. . . . . . . . . . . . . . . . . . . . . . . . . . . $ 823,723 $ 1,429,693 $ 1,569,871
The accompanying notes are an integral part of these consolidated financial statements.
59