Yahoo 2006 Annual Report Download - page 47
Download and view the complete annual report
Please find page 47 of the 2006 Yahoo annual report below. You can navigate through the pages in the report by either clicking on the pages listed below, or by using the keyword search tool below to find specific information within the annual report.-
 1
1 -
2
-
3
-
4
-
5
-
6
-
7
-
8
-
9
-
10
-
11
-
12
-
13
-
14
-
15
-
16
-
17
-
18
-
19
-
20
-
21
-
22
-
23
-
24
-
25
-
26
-
27
-
28
-
29
-
30
-
31
-
32
-
33
-
34
-
35
-
36
-
 37
37 -
 38
38 -
 39
39 -
 40
40 -
 41
41 -
 42
42 -
 43
43 -
 44
44 -
 45
45 -
 46
46 -
 47
47 -
 48
48 -
 49
49 -
 50
50 -
 51
51 -
 52
52 -
 53
53 -
 54
54 -
 55
55 -
 56
56 -
 57
57 -
58
-
59
-
60
-
61
-
62
-
63
-
64
-
65
-
66
-
67
-
68
-
69
-
70
-
71
-
72
-
73
-
74
-
75
-
76
-
77
-
78
-
79
-
80
-
81
-
82
-
83
-
84
-
85
-
86
-
87
-
88
-
89
-
90
-
91
-
92
-
93
-
94
-
95
-
96
-
97
-
98
-
99
-
100
-
101
-
102
-
103
-
104
-
105
-
106
-
107
-
108
-
109
-
110
-
111
-
112
-
113
-
114
-
115
-
116
-
117
-
118
-
119
-
120
-
121
-
122
-
123
-
124
-
125
-
126
 |
 |

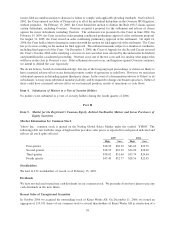
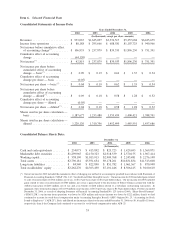
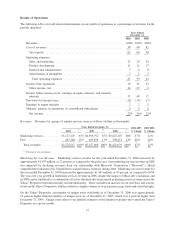
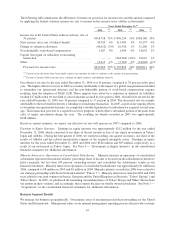
Results of Operations
The following table sets forth selected information on our results of operations as a percentage of revenues for the
periods indicated:
2004 2005 2006
Years Ended
December 31,
Revenues. . . .................................................. 100% 100% 100%
Cost of revenues ............................................... 38 40 42
Gross profit ................................................. 62 60 58
Operating expenses:
Sales and marketing ........................................... 22 20 20
Product development .......................................... 11 11 13
General and administrative ...................................... 7 6 8
Amortization of intangibles ..................................... 3 2 2
Total operating expenses ...................................... 43 39 43
Income from operations .......................................... 19 21 15
Other income, net ............................................ 14 27 2
Income before income taxes, earnings in equity interests, and minority
interests . . .................................................. 33 48 17
Provision for income taxes ........................................ (12) (14) (7)
Earnings in equity interests ....................................... 2 2 2
Minority interests in operations of consolidated subsidiaries ............... 0 0 0
Net income ................................................. 23% 36% 12%
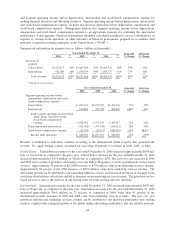
Revenues. Revenues by groups of similar services were as follows (dollars in thousands):
2004
(*)
2005
(*)
2006
(*)
2004-2005
% Change
2005-2006
% Change
Years Ended December 31,
Marketing services.......... $3,127,229 87% $4,593,972 87% $5,627,207 88% 47% 22%
Fees .................... 447,288 13% 663,696 13% 798,472 12% 48% 20%
Total revenues ........... $3,574,517 100% $5,257,668 100% $6,425,679 100% 47% 22%
(*)
Percent of total revenues.
Marketing Services Revenue. Marketing services revenue for the year ended December 31, 2006 increased by
approximately $1,033 million, or 22 percent, as compared to the prior year. Our marketing services revenue in 2006
was impacted by declining revenues from our relationship with Microsoft Corporation (“Microsoft”), which
completed the transition of its United States search business in-house during 2006. Marketing services revenue for
the year ended December 31, 2005 increased by approximately $1,467 million, or 47 percent, as compared to 2004.
The year over year growth in marketing services revenue in 2006, despite the impact of Microsoft’s transition, and
in 2005 can be attributed to a combination of factors that have driven increased marketing service revenue across the
Yahoo! Properties both domestically and internationally. These included an increase in our user base and activity
levels on the Yahoo! Properties, which resulted in a higher volume of search queries, page views and click-throughs.
On the Yahoo! Properties, our number of unique users worldwide as of December 31, 2006 was approximately
16 percent higher than the number of unique users as of December 31, 2005, which was 6 percent higher than
December 31, 2004. Unique users refers to our internal estimates of the number of people who visited the Yahoo!
Properties in a given month.
37