Yahoo 2006 Annual Report Download - page 57
Download and view the complete annual report
Please find page 57 of the 2006 Yahoo annual report below. You can navigate through the pages in the report by either clicking on the pages listed below, or by using the keyword search tool below to find specific information within the annual report.-
 1
1 -
2
-
3
-
4
-
5
-
6
-
7
-
8
-
9
-
10
-
11
-
12
-
13
-
14
-
15
-
16
-
17
-
18
-
19
-
20
-
21
-
22
-
23
-
24
-
25
-
26
-
27
-
28
-
29
-
30
-
31
-
32
-
33
-
34
-
35
-
36
-
37
-
38
-
39
-
40
-
41
-
42
-
43
-
44
-
45
-
46
-
 47
47 -
 48
48 -
 49
49 -
 50
50 -
 51
51 -
 52
52 -
 53
53 -
 54
54 -
 55
55 -
 56
56 -
 57
57 -
 58
58 -
 59
59 -
 60
60 -
 61
61 -
 62
62 -
 63
63 -
 64
64 -
 65
65 -
 66
66 -
 67
67 -
68
-
69
-
70
-
71
-
72
-
73
-
74
-
75
-
76
-
77
-
78
-
79
-
80
-
81
-
82
-
83
-
84
-
85
-
86
-
87
-
88
-
89
-
90
-
91
-
92
-
93
-
94
-
95
-
96
-
97
-
98
-
99
-
100
-
101
-
102
-
103
-
104
-
105
-
106
-
107
-
108
-
109
-
110
-
111
-
112
-
113
-
114
-
115
-
116
-
117
-
118
-
119
-
120
-
121
-
122
-
123
-
124
-
125
-
126
 |
 |
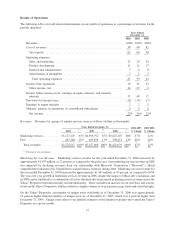
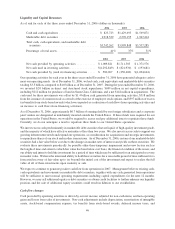
earnings in equity interests. Cash provided by operating activities was greater than net income in 2006 mainly due
to the net impact of non-cash adjustments to income. In each of the three years ended December 31, 2006, 2005, and
2004, cash flows from operations were reduced by the increase in our accounts receivable balance, mainly reflecting
increases in revenues. The days of sales outstanding metric increased over the three years ended December 31,
2006. Additionally, in the years ended December 31, 2006, 2005, and 2004, there were significant increases in
accrued expenses and other liabilities that positively impacted cash flow from operations. These increases were
mainly due to higher accrual balances for TAC payments to affiliates arising from increased revenue.
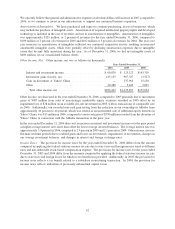
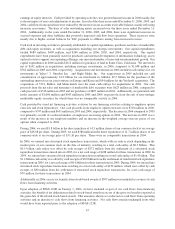
Cash used in investing activities is primarily attributable to capital expenditures, purchases and sales of marketable
debt and equity securities, as well as acquisitions including our strategic investments. Our capital expenditures
totaled $689 million, $409 million, and $246 million in 2006, 2005, and 2004, respectively. Our capital
expenditures have been primarily used for purchases and internal development of information technology assets
and real estate to support our expanding offerings, our increased number of users and our international growth. Our
capital expenditures in 2006 included $112 million for purchase of land in Santa Clara, California. We invested a
net of $142 million in acquisitions, including strategic investments, in 2006, compared to $1,698 million and
$762 million in 2005 and 2004, respectively. Acquisitions and investments in 2006 included cash outlays for our
investments in Yahoo! 7, Gmarket Inc. and Right Media Inc. Our acquisitions in 2005 included net cash
consideration of approximately $1.0 billion for our investment in Alibaba, $0.5 billion for the purchase of the
outstanding interests in our joint ventures in Europe and Korea and $54 million for the Verdisoft acquisition. The
acquisitions of 3721, Kelkoo, and Musicmatch were the main cash outlays for acquisitions in 2004. Our cash
proceeds from the net sales and maturities of marketable debt securities were $623 million in 2006, compared to
cash proceeds of $318 million in 2005 and net purchases of $807 million in 2004. Additionally, we generated cash
in the amounts of $1,006 million and $503 million in 2005 and 2004, respectively, from the sale of non-strategic
marketable equity securities for which there was no comparable activity in 2006.
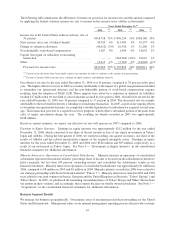
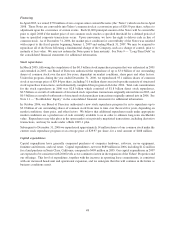
Cash provided by (used in) financing activities is driven by our financing activities relating to employee option
exercises and stock repurchases. Our cash proceeds from employee option exercises were $318 million in 2006,
compared to $747 million and $651 million in 2005 and 2004, respectively. The decrease in 2006 compared to 2005
was primarily a result of a reduced number of employees exercising options in 2006. The increase in 2005 was a
result of the increase in our employee numbers and an increase in the weighted average exercise prices of our
options when compared to 2004.
During 2006, we used $1.8 billon in the direct purchase of 61.5 million shares of our common stock at an average
price of $28.98 per share. During 2005, we used $388 million in the direct repurchase of 11.7 million shares of our
common stock at an average price of $33.20 per share. There were no comparable transactions in 2004.
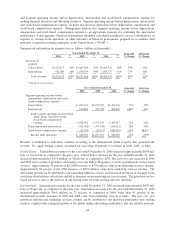
In 2006, we entered into structured stock repurchase transactions, which settle in cash or stock depending on the
market price of our common stock on the date of maturity, resulting in a total cash outlay of $0.5 billion. This
$0.5 billion cash outlay was offset by cash receipts of $272 million from the settlement of a structured stock
repurchase transactions entered into in 2005, for a net cash usage of $228 million for these transactions in 2006. In
2005, we entered into structured stock repurchase transactions resulting in a total cash outlay of $1.4 billion. This
$1.4 billion cash outlay was offset by cash receipts of $0.8 billion from the settlement of structured stock repurchase
transactions in 2005, for a net cash usage of $0.6 billion for these transactions in 2005. During 2004, we entered into
structured stock repurchase transactions resulting in a total cash outlay of $150 million, which were offset by cash
receipts of $80 million from the settlement of structured stock repurchase transactions, for a net cash usage of
$70 million for these transactions in 2004.
Additionally, in 2006, excess tax benefits from stock-based awards of $597 million was included as a source of cash
flows from financing activities.
Upon adoption of SFAS 123R on January 1, 2006, we have included as part of our cash flows from financing
activities, the benefit of tax deductions related to stock-based awards in excess of the gross tax benefits expected at
the grant date of the related stock-based awards. This amount is shown as a reduction to cash flows from operating
activities and an increase to cash flows from financing activities. Net cash flows remain unchanged from what
would have been reported prior to the adoption of SFAS 123R.
47