Yahoo 2006 Annual Report Download - page 63
Download and view the complete annual report
Please find page 63 of the 2006 Yahoo annual report below. You can navigate through the pages in the report by either clicking on the pages listed below, or by using the keyword search tool below to find specific information within the annual report.-
 1
1 -
2
-
3
-
4
-
5
-
6
-
7
-
8
-
9
-
10
-
11
-
12
-
13
-
14
-
15
-
16
-
17
-
18
-
19
-
20
-
21
-
22
-
23
-
24
-
25
-
26
-
27
-
28
-
29
-
30
-
31
-
32
-
33
-
34
-
35
-
36
-
37
-
38
-
39
-
40
-
41
-
42
-
43
-
44
-
45
-
46
-
47
-
48
-
49
-
50
-
51
-
52
-
 53
53 -
 54
54 -
 55
55 -
 56
56 -
 57
57 -
 58
58 -
 59
59 -
 60
60 -
 61
61 -
 62
62 -
 63
63 -
 64
64 -
 65
65 -
 66
66 -
 67
67 -
 68
68 -
 69
69 -
 70
70 -
 71
71 -
 72
72 -
 73
73 -
74
-
75
-
76
-
77
-
78
-
79
-
80
-
81
-
82
-
83
-
84
-
85
-
86
-
87
-
88
-
89
-
90
-
91
-
92
-
93
-
94
-
95
-
96
-
97
-
98
-
99
-
100
-
101
-
102
-
103
-
104
-
105
-
106
-
107
-
108
-
109
-
110
-
111
-
112
-
113
-
114
-
115
-
116
-
117
-
118
-
119
-
120
-
121
-
122
-
123
-
124
-
125
-
126
 |
 |
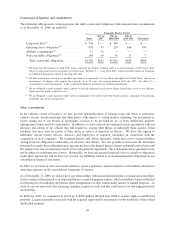
market price falls. The interest and market value changes affect the fair market value of the Notes but do not impact
our financial position, cash flows or results of operations. As of December 31, 2006 and 2005, the fair value of the
Notes was approximately $1.0 billion and $1.4 billion, respectively, based on quoted market prices.
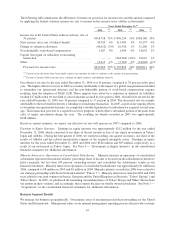
Foreign Currency Risk. International revenues accounted for approximately 32 percent of total revenues in 2006,
compared to 30 percent of total revenues in 2005. International revenues in 2006 increased $470 million, or
30 percent, compared to the prior year. The growth in our international operations has increased our exposure to
foreign currency fluctuations. Revenues and related expenses generated from our international subsidiaries are
generally denominated in the functional currencies of the local countries. Primary currencies include Euros, British
Pounds, Japanese Yen, Korean Won and Australian Dollars. The statements of income of our international
operations are translated into United States dollars at the average exchange rates in each applicable period. To the
extent the United States dollar strengthens against foreign currencies, the translation of these foreign currency
denominated transactions results in reduced revenues, operating expenses and net income for our International
segment. Similarly, our revenues, operating expenses and net income will increase for our International segment, if
the United States dollar weakens against foreign currencies. The application of our 2005 average foreign currency
exchange rates to our international revenues and segment operating income before depreciation, amortization and
stock-based compensation expense in 2006 would have had an immaterial impact on our reported results. Using the
average foreign currency exchange rates from 2004, our international revenues for 2005 would have been lower
than we reported by approximately $42 million and our international segment operating income before depre-
ciation, amortization and stock-based compensation expense would have been lower than we reported by $8 million.
We are also exposed to foreign exchange rate fluctuations as we convert the financial statements of our foreign
subsidiaries and our investments in equity interests into United States dollars in consolidation. If there is a change in
foreign currency exchange rates, the conversion of the foreign subsidiaries’ financial statements into United States
dollars will lead to a translation gain or loss which is recorded as a component of accumulated other comprehensive
income which is part of stockholders’ equity. In addition, we have certain assets and liabilities that are denominated
in currencies other than the relevant entity’s functional currency. Changes in the functional currency value of these
assets and liabilities create fluctuations that will lead to a transaction gain or loss. In the year ended December 31,
2006, we recorded net foreign currency transaction gains, realized and unrealized, of approximately $5 million, net
losses of $8 million and net gains of $6 million in 2005 and 2004, respectively, which were recorded in other
income, net on the consolidated statements of income.
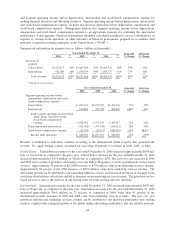
Investment Risk. The primary objective of our investment activities is to preserve principal while at the same time
maximizing yields without significantly increasing risk. To achieve this objective, we maintain our portfolio of
cash equivalents and current and long-term investments in a variety of securities, including both government and
corporate obligations and money market funds. As of December 31, 2006 and 2005, net unrealized losses on these
investments were not material.
We are exposed to market risk as it relates to changes in the market value of our investments. We invest in equity
instruments of public companies for business and strategic purposes and have classified these securities as
available-for-sale. These available-for-sale equity investments are subject to significant fluctuations in fair value
due to the volatility of the stock market and the industries in which these companies participate. We have realized
gains and losses from the sale of investments, as well as impairment charges on some of our investments. In 2006,
we recorded an impairment loss of $4 million on an available-for-sale equity investment, compared to $28 million
recorded in 2005. Our investments in available-for-sale equity securities were not material as of December 31, 2006
and 2005. Our objective in managing exposure to stock market fluctuations is to minimize the impact of stock
market declines to earnings and cash flows. Using a hypothetical reduction of 10 percent in the stock price of these
equity securities, the fair value of our equity investments would decrease by approximately $11 million and
$3 million as of December 31, 2006 and 2005, respectively.
53