Yahoo 2006 Annual Report Download - page 107
Download and view the complete annual report
Please find page 107 of the 2006 Yahoo annual report below. You can navigate through the pages in the report by either clicking on the pages listed below, or by using the keyword search tool below to find specific information within the annual report.-
 1
1 -
2
-
3
-
4
-
5
-
6
-
7
-
8
-
9
-
10
-
11
-
12
-
13
-
14
-
15
-
16
-
17
-
18
-
19
-
20
-
21
-
22
-
23
-
24
-
25
-
26
-
27
-
28
-
29
-
30
-
31
-
32
-
33
-
34
-
35
-
36
-
37
-
38
-
39
-
40
-
41
-
42
-
43
-
44
-
45
-
46
-
47
-
48
-
49
-
50
-
51
-
52
-
53
-
54
-
55
-
56
-
57
-
58
-
59
-
60
-
61
-
62
-
63
-
64
-
65
-
66
-
67
-
68
-
69
-
70
-
71
-
72
-
73
-
74
-
75
-
76
-
77
-
78
-
79
-
80
-
81
-
82
-
83
-
84
-
85
-
86
-
87
-
88
-
89
-
90
-
91
-
92
-
93
-
94
-
95
-
96
-
 97
97 -
 98
98 -
 99
99 -
 100
100 -
 101
101 -
 102
102 -
 103
103 -
 104
104 -
 105
105 -
 106
106 -
 107
107 -
 108
108 -
 109
109 -
 110
110 -
 111
111 -
 112
112 -
 113
113 -
 114
114 -
 115
115 -
 116
116 -
 117
117 -
118
-
119
-
120
-
121
-
122
-
123
-
124
-
125
-
126
 |
 |

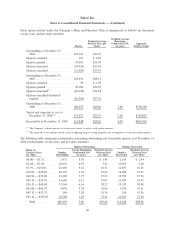
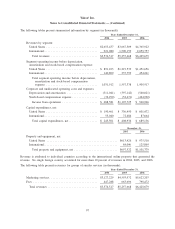
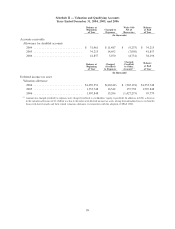
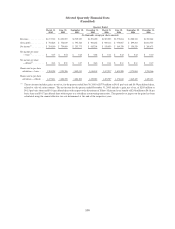
The following tables present summarized information by segment (in thousands):
2004 2005 2006
Years Ended December 31,
Revenues by segment:
United States ................................ $2,653,437 $3,667,509 $4,365,922
International ................................. 921,080 1,590,159 2,059,757
Total revenues ............................. $3,574,517 $5,257,668 $6,425,679
Segment operating income before depreciation,
amortization and stock-based compensation expense:
United States ................................ $ 891,103 $1,219,539 $1,451,656
International ................................. 140,809 337,799 454,261
Total segment operating income before depreciation,
amortization and stock-based compensation
expense: ................................ 1,031,912 1,557,338 1,905,917
Corporate and unallocated operating costs and expenses:
Depreciation and amortization ................... (311,041) (397,142) (540,021)
Stock-based compensation expense . . .............. (32,290) (52,471) (424,930)
Income from operations ...................... $ 688,581 $1,107,725 $ 940,966
Capital expenditures, net:
United States ................................ $ 190,461 $ 336,450 $ 601,472
International ................................. 55,040 72,484 87,664
Total capital expenditures, net .................. $ 245,501 $ 408,934 $ 689,136
2005 2006
December 31,
Property and equipment, net:
United States ............................................ $613,426 $ 975,510
International ............................................. 84,096 125,869
Total property and equipment, net ........................... $697,522 $1,101,379
Revenue is attributed to individual countries according to the international online property that generated the
revenue. No single foreign country accounted for more than 10 percent of revenues in 2004, 2005, and 2006.
The following table presents revenues for groups of similar services (in thousands):
2004 2005 2006
Years Ended December 31,
Marketing services .............................. $3,127,229 $4,593,972 $5,627,207
Fees ........................................ 447,288 663,696 798,472
Total revenues ............................... $3,574,517 $5,257,668 $6,425,679
97
Yahoo! Inc.
Notes to Consolidated Financial Statements — (Continued)