Yahoo 2006 Annual Report Download - page 48
Download and view the complete annual report
Please find page 48 of the 2006 Yahoo annual report below. You can navigate through the pages in the report by either clicking on the pages listed below, or by using the keyword search tool below to find specific information within the annual report.-
 1
1 -
2
-
3
-
4
-
5
-
6
-
7
-
8
-
9
-
10
-
11
-
12
-
13
-
14
-
15
-
16
-
17
-
18
-
19
-
20
-
21
-
22
-
23
-
24
-
25
-
26
-
27
-
28
-
29
-
30
-
31
-
32
-
33
-
34
-
35
-
36
-
37
-
 38
38 -
 39
39 -
 40
40 -
 41
41 -
 42
42 -
 43
43 -
 44
44 -
 45
45 -
 46
46 -
 47
47 -
 48
48 -
 49
49 -
 50
50 -
 51
51 -
 52
52 -
 53
53 -
 54
54 -
 55
55 -
 56
56 -
 57
57 -
 58
58 -
59
-
60
-
61
-
62
-
63
-
64
-
65
-
66
-
67
-
68
-
69
-
70
-
71
-
72
-
73
-
74
-
75
-
76
-
77
-
78
-
79
-
80
-
81
-
82
-
83
-
84
-
85
-
86
-
87
-
88
-
89
-
90
-
91
-
92
-
93
-
94
-
95
-
96
-
97
-
98
-
99
-
100
-
101
-
102
-
103
-
104
-
105
-
106
-
107
-
108
-
109
-
110
-
111
-
112
-
113
-
114
-
115
-
116
-
117
-
118
-
119
-
120
-
121
-
122
-
123
-
124
-
125
-
126
 |
 |
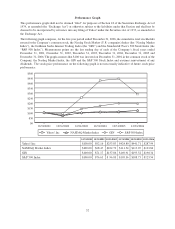
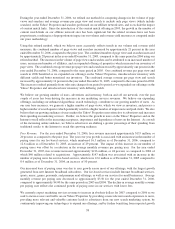
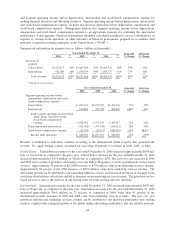
During the year ended December 31, 2006, we refined our method for computing changes in the volume of page
views and searches and average revenue per page view and search to include only page views (which include
searches) on the Yahoo! Properties and searches performed on our affiliate network sites, and to exclude the impact
of content match links. Since the introduction of the content match offering in 2005, the growth in the number of
content match links on our affiliate network sites has been significant but the related revenues have not been
proportionate, resulting in a disproportionate impact on our volume and revenue yield measures as computed under
our prior methodology.
Using this refined method, which we believe more accurately reflects trends in our volume and revenue yield
measures, the combined number of page views and searches increased by approximately 21 percent in the year
ended December 31, 2006, compared to the prior year. The combined number of page views and searches increased
by approximately 28 percent in the year ended December 31, 2005, compared to the same period in 2004 using our
refined method. The increases in the volume of page views and searches can be attributed to an increased number of
users, an increased number of affiliates, and an expanded offering of properties which increased our inventory of
page views. The combined average revenue per page view and search increased by approximately one percent in the
year ended December 31, 2006, compared to the same period in 2005. Our combined revenue per page view and
search in 2006 benefited as we expanded our offerings on the Yahoo! Properties, introduced new inventory with
different yields and better monetized our inventory. The combined average revenue per page view and search
increased by approximately 14 percent in the year ended December 31, 2005, compared to the same period in 2004.
This increase resulted primarily from sales mix changes from period to period as we expanded our offerings on the
Yahoo! Properties and introduced new inventory with differing yields.
We believe our growing number of users, advertisers and inventory, both on and off our network, over the past
couple of years has been driving the increases in our marketing services revenues. We believe our expanding
offerings, including our enhanced algorithmic search technology, contribute to our growing number of users. As
our user base increases, we generate a higher number of page views, which we view as inventory, and process a
higher number of search queries which potentially result in a higher number of impressions and paid clicks. We also
believe that our growing audience of users makes the Yahoo! Properties more attractive to advertisers and increases
their spending on marketing services. Further, we believe the growth in users on the Yahoo! Properties and on the
Internet overall reflects the increasing acceptance, importance and dependence of users on the Internet. As a result
of the increasing online audience, we believe advertisers are shifting a greater percentage of their spending from
traditional media to the Internet to reach this growing audience.
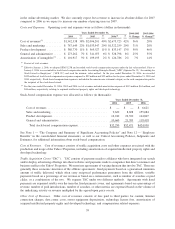
Fees Revenue. For the year ended December 31, 2006, fees revenue increased approximately $135 million, or
20 percent, as compared to the prior year. The year over year growth is associated with an increase in the number of
paying users for our fee-based services, which numbered 16.3 million as of December 31, 2006, compared to
12.6 million as of December 31, 2005, an increase of 29 percent. The impact of this increase in our number of
paying users was offset by a reduction in the average monthly revenues per paying user. For the year ended
December 31, 2005, fees revenue increased approximately $216 million, or 48 percent, as compared to 2004 of
which $46 million related to acquisitions. Approximately $147 million was associated with an increase in the
number of paying users for our fee-based services, which were 12.6 million as of December 31, 2005 compared to
8.4 million as of December 31, 2004, an increase of 50 percent.
Our increased base of paying users was due to user growth across most of our offerings, with the largest growth
generated from new Internet broadband subscribers. Our fee-based services include Internet broadband services,
sports, music, games, personals, and premium mail offerings, as well as our services for small businesses. Average
monthly revenue per paying user decreased to approximately $3.50 for the year ended December 31, 2006,
compared to approximately $4.00 for the same periods in 2005 and 2004. The decline in average monthly revenue
per paying user reflects the continued growth of paying users in our services with lower fees.
We currently expect marketing services revenue to increase in absolute dollars for 2007 compared to 2006 as we
seek to increase users and traffic on our Yahoo! Properties by providing a more relevant search experience to users,
providing more relevant and valuable customer leads to advertisers from our new search marketing system, by
continuously improving our technologies to expand our offerings, and by further benefiting from expected growth
38