Yahoo 2006 Annual Report Download - page 79
Download and view the complete annual report
Please find page 79 of the 2006 Yahoo annual report below. You can navigate through the pages in the report by either clicking on the pages listed below, or by using the keyword search tool below to find specific information within the annual report.-
 1
1 -
2
-
3
-
4
-
5
-
6
-
7
-
8
-
9
-
10
-
11
-
12
-
13
-
14
-
15
-
16
-
17
-
18
-
19
-
20
-
21
-
22
-
23
-
24
-
25
-
26
-
27
-
28
-
29
-
30
-
31
-
32
-
33
-
34
-
35
-
36
-
37
-
38
-
39
-
40
-
41
-
42
-
43
-
44
-
45
-
46
-
47
-
48
-
49
-
50
-
51
-
52
-
53
-
54
-
55
-
56
-
57
-
58
-
59
-
60
-
61
-
62
-
63
-
64
-
65
-
66
-
67
-
68
-
 69
69 -
 70
70 -
 71
71 -
 72
72 -
 73
73 -
 74
74 -
 75
75 -
 76
76 -
 77
77 -
 78
78 -
 79
79 -
 80
80 -
 81
81 -
 82
82 -
 83
83 -
 84
84 -
 85
85 -
 86
86 -
 87
87 -
 88
88 -
 89
89 -
90
-
91
-
92
-
93
-
94
-
95
-
96
-
97
-
98
-
99
-
100
-
101
-
102
-
103
-
104
-
105
-
106
-
107
-
108
-
109
-
110
-
111
-
112
-
113
-
114
-
115
-
116
-
117
-
118
-
119
-
120
-
121
-
122
-
123
-
124
-
125
-
126
 |
 |

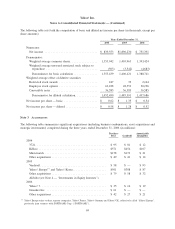
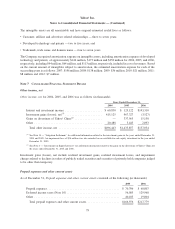
The following table sets forth the computation of basic and diluted net income per share (in thousands, except per
share amounts):
2004 2005 2006
Years Ended December 31,
Numerator:
Net income ................................. $ 839,553 $1,896,230 $ 751,391
Denominator:
Weighted average common shares . . . .............. 1,353,942 1,403,963 1,393,424
Weighted average unvested restricted stock subject to
repurchase ................................ (503) (3,542) (4,683)
Denominator for basic calculation . .............. 1,353,439 1,400,421 1,388,741
Weighted average effect of dilutive securities:
Restricted stock awards ........................ 247 33 2,164
Employee stock options ........................ 62,228 48,552 30,196
Convertible notes ............................. 36,585 36,585 36,585
Denominator for diluted calculation.............. 1,452,499 1,485,591 1,457,686
Net income per share — basic ..................... $ 0.62 $ 1.35 $ 0.54
Net income per share — diluted .................... $ 0.58 $ 1.28 $ 0.52
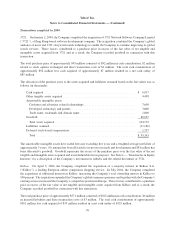
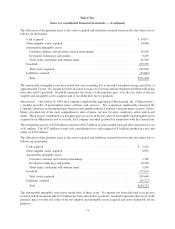
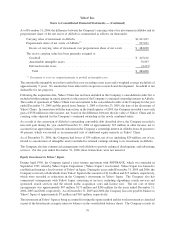
Note 3 ACQUISITIONS
The following table summarizes significant acquisitions (including business combinations, asset acquisitions and
strategic investments) completed during the three years ended December 31, 2006 (in millions):
Purchase
Price Goodwill
Amortizable
Intangibles
2004
3721 ............................................ $ 95 $ 81 $ 12
Kelkoo .......................................... $571 $454 $107
Musicmatch ...................................... $158 $172 $ 21
Other acquisitions . . ................................ $ 49 $ 41 $ 14
2005
Verdisoft ......................................... $ 58 $ — $ 93
Yahoo! Europe
(*)
and Yahoo! Korea..................... $501 $388 $ 87
Other acquisitions . . ................................ $ 79 $ 58 $ 32
Alibaba (see Note 4 — “Investments in Equity Interests”)
2006
Yahoo! 7......................................... $ 35 $ 16 $ 19
Gmarket Inc. ..................................... $ 61 $ — $ —
Other acquisitions . . ................................ $ 42 $ 27 $ 21
(*)
Yahoo! Europe refers to three separate companies, Yahoo! France, Yahoo! Germany and Yahoo! UK, collectively called “Yahoo! Europe”,
previously joint ventures with SOFTBANK Corp. (“SOFTBANK”).
69
Yahoo! Inc.
Notes to Consolidated Financial Statements — (Continued)